How to Export Data to Google Sheets
This how-to guide creates a chart in Google Sheets depicting the distribution of storage across accounts:
We will first perform a search that aggregates all storage volumes across all clouds and accounts and returns the total size of all volumes per account. We will then pipe the aggregated result into the format command to flatten the data into rows and columns, and export the data as a CSV file. Finally, we will import the CSV-format data into Google Sheets and create a pie chart.
Prerequisites
This guide assumes that you have already installed and configured Fix Inventory to collect your cloud resources.
Directions
-
Execute the following aggregate search in Fix Inventory Shell:
> search aggregate(/ancestors.cloud.reported.name as cloud, /ancestors.account.reported.name as account: sum(volume_size * 1024 * 1024 * 1024) as volume_bytes): is(volume)
---
group:
cloud: aws
account: sales-demo
volume_bytes: 2123861327872
---
group:
cloud: aws
account: eng-scaletesting
volume_bytes: 10733123272704
---
group:
cloud: aws
account: general-support
volume_bytes: 6096706076672 -
Next, pipe the search result into the
formatcommand to flatten it into rows and columns:> search aggregate(/ancestors.cloud.reported.name as cloud, /ancestors.account.reported.name as account: sum(volume_size * 1024 * 1024 * 1024) as volume_bytes): is(volume) | format {/group.cloud} {/group.account},{/volume_bytes}
cloud,account,volume_bytes
aws,sales-demo,2123861327872
aws,eng-scaletesting,10733123272704
aws,general-support,6096706076672 -
Then, use the
writecommand to output the data to a CSV file on our local disk:> search aggregate(/ancestors.cloud.reported.name as cloud, /ancestors.account.reported.name as account: sum(volume_size * 1024 * 1024 * 1024) as volume_bytes): is(volume) | format {/group.cloud} {/group.account},{/volume_bytes} | write storage.csv
Received a file storage.csv, which is stored to ./storage.csv.The resulting CSV now contains a list of cloud providers and their associated account names and storage sizes:
storage.csvgcp eng-platform-e2e-night,4006130745344
gcp maestro-124419,183609851904
gcp sre-tests,10737418240
gcp kubecon-demo,10737418240
gcp eng-platform,3081639034880
gcp gcp-se,1501091069952
gcp support,63350767616
digitalocean 10225075,185757335552
aws eng-testmatrix,42949672960
aws eng-devprod,309237645312
aws eng-qualification,214748364800
aws eng-sre,8589934592
aws eng-insights,268435456000
aws scaletesting,2194728288256
aws eng-ds,12474732511232
aws sales-se,7816840478720
aws eng-kudos,7823282929664
aws eng-platform,10393820856320
aws eng-soak,13278965137408
aws eng-production,63944546844672
aws jenkins,2164663517184
aws general-services,7095285972992
aws sales-se,2123861327872
aws eng-scaletesting,10733123272704
aws general-support,6096706076672 -
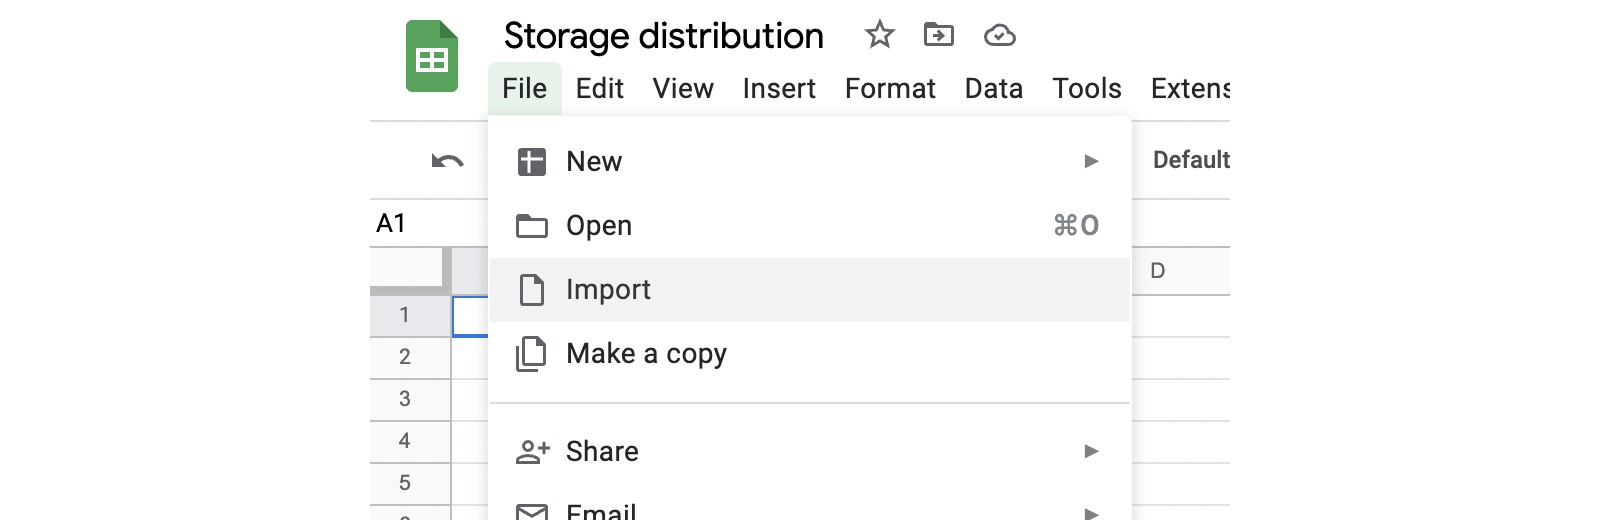
Open Import from the File menu and select the Upload tab:
-
Drag and drop the
storage.csvfile generated in step 3 into the Import file dialog: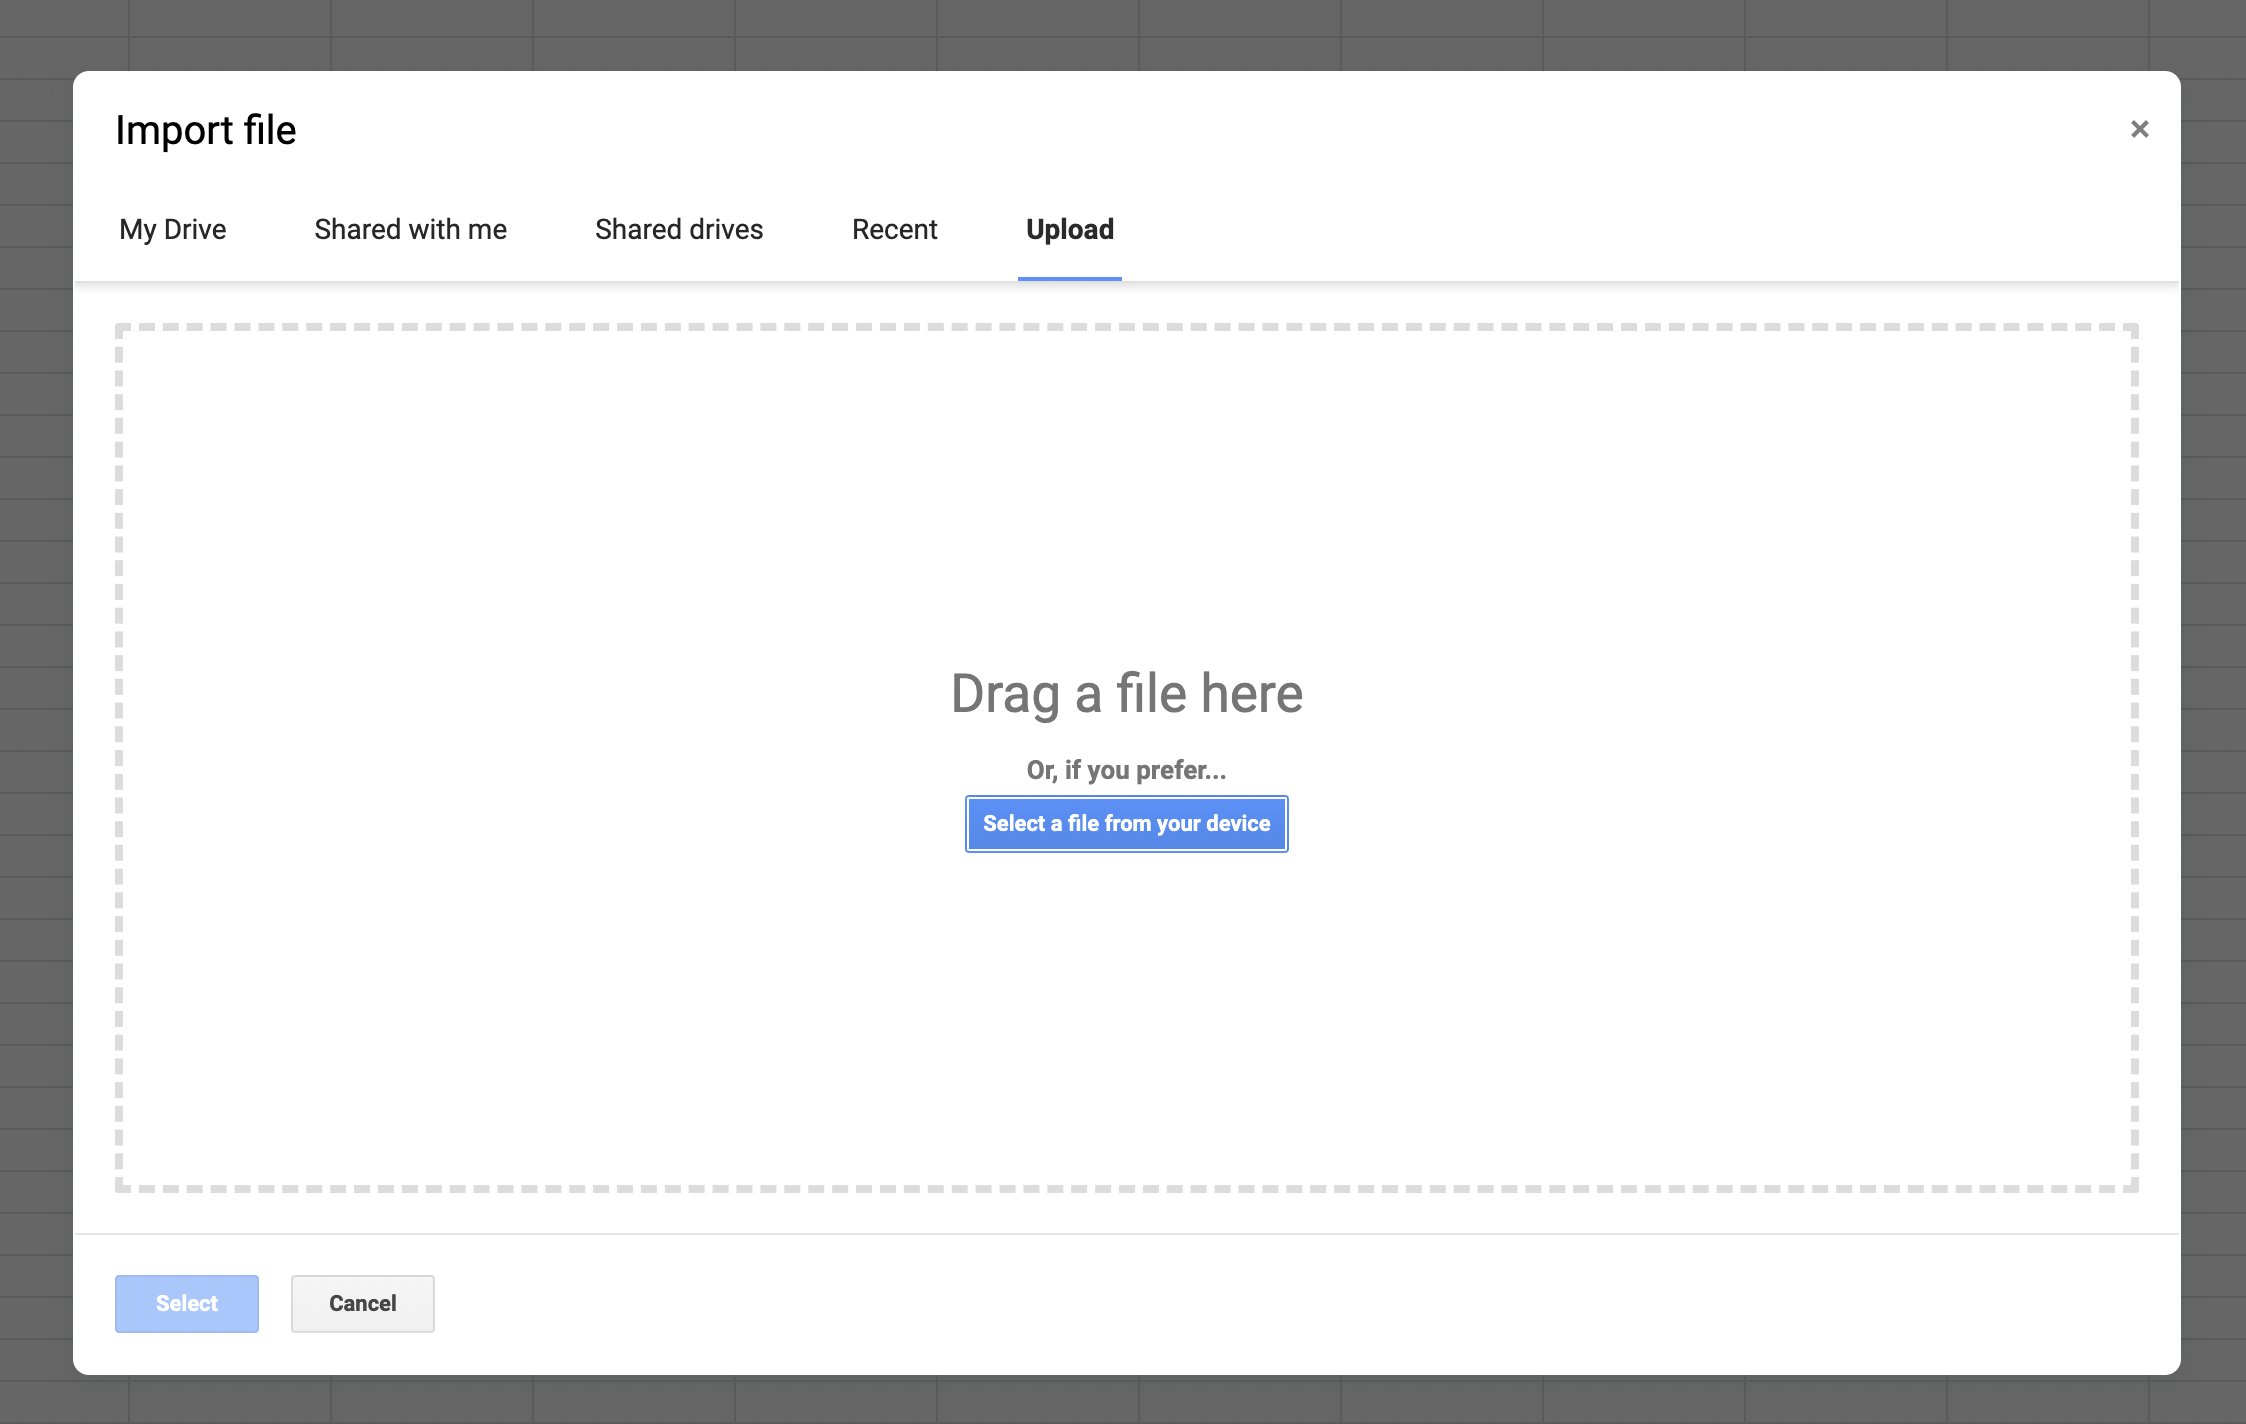
-
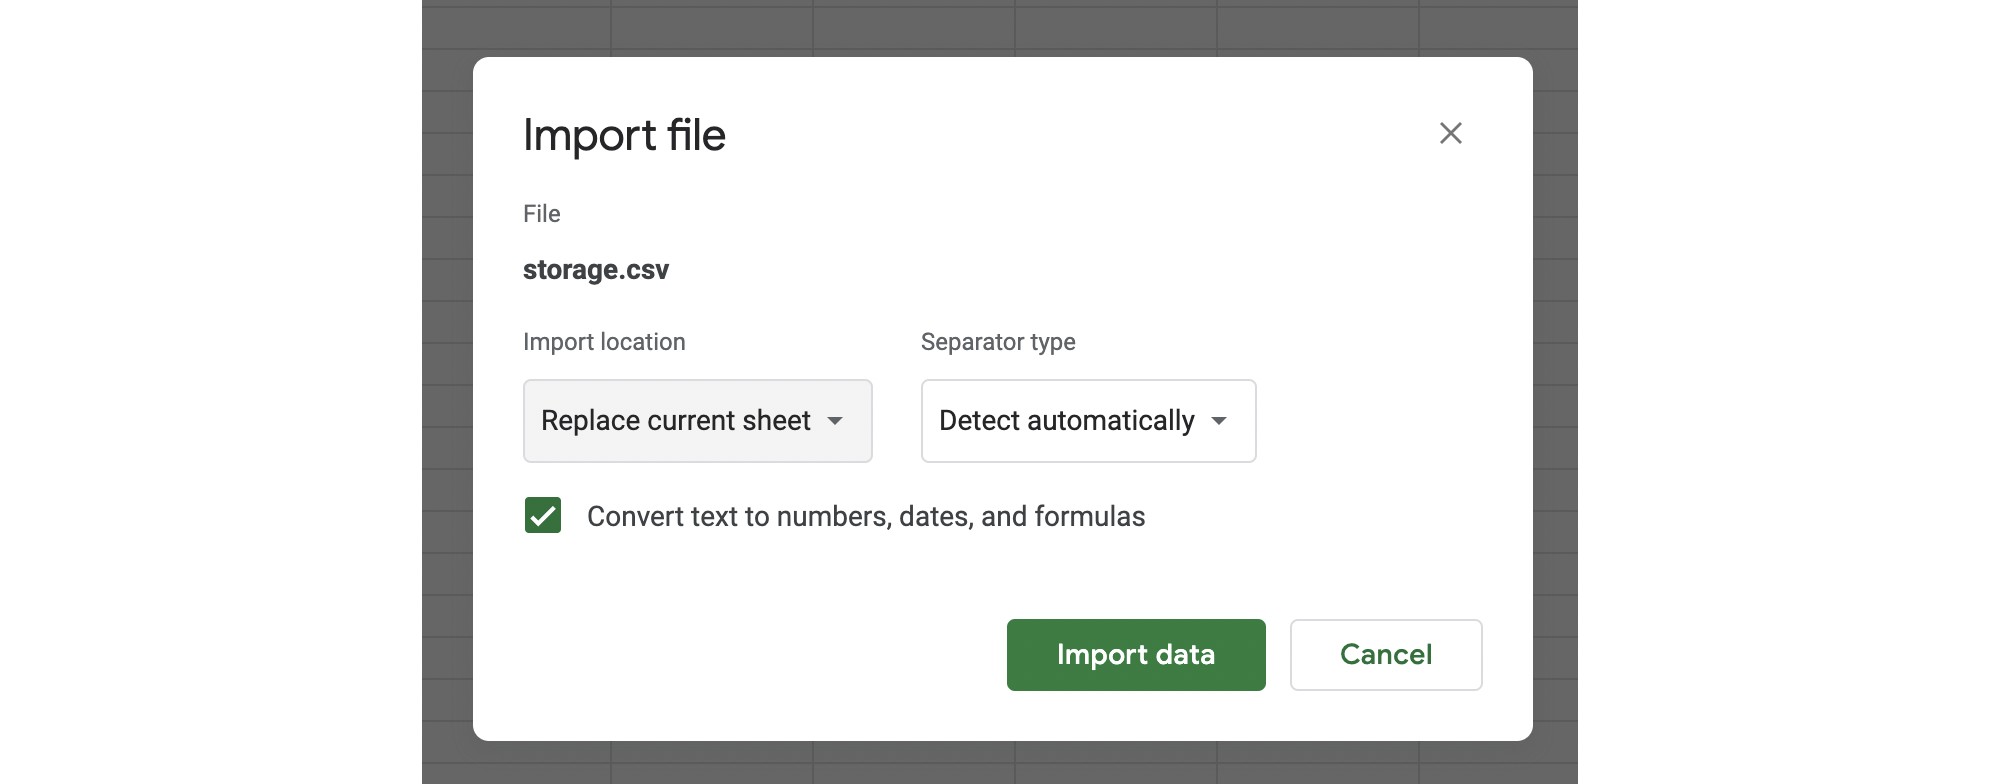
Select Replace current sheet and click Import data:
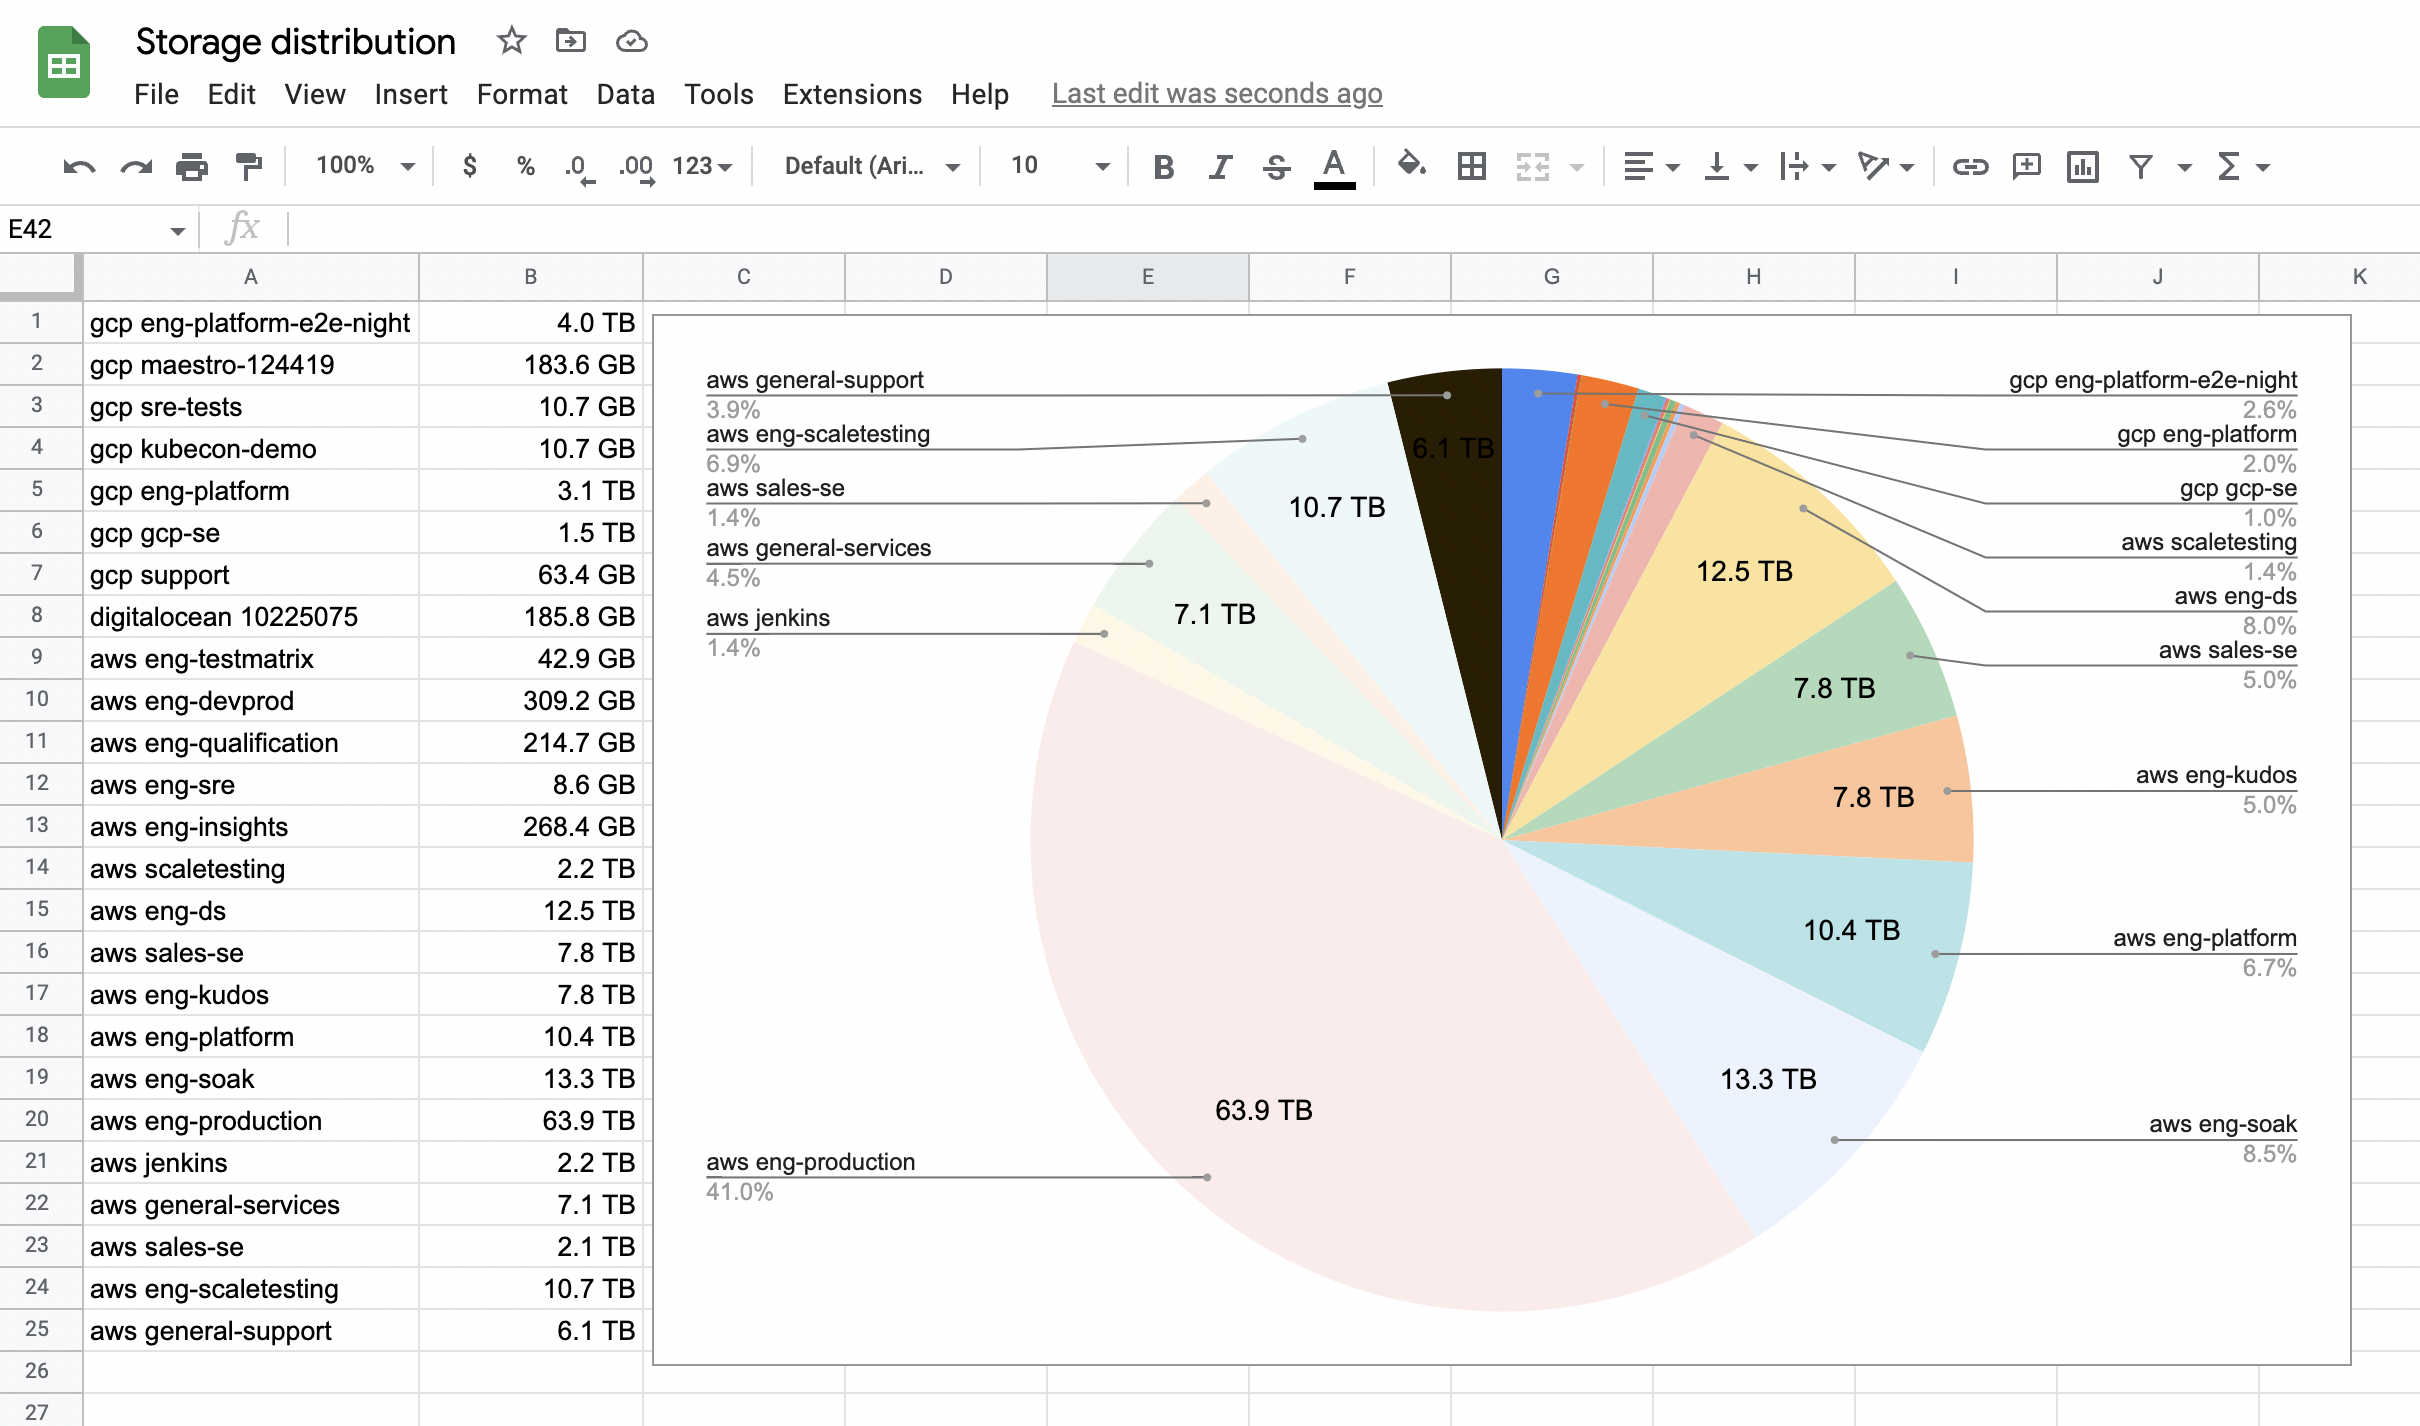
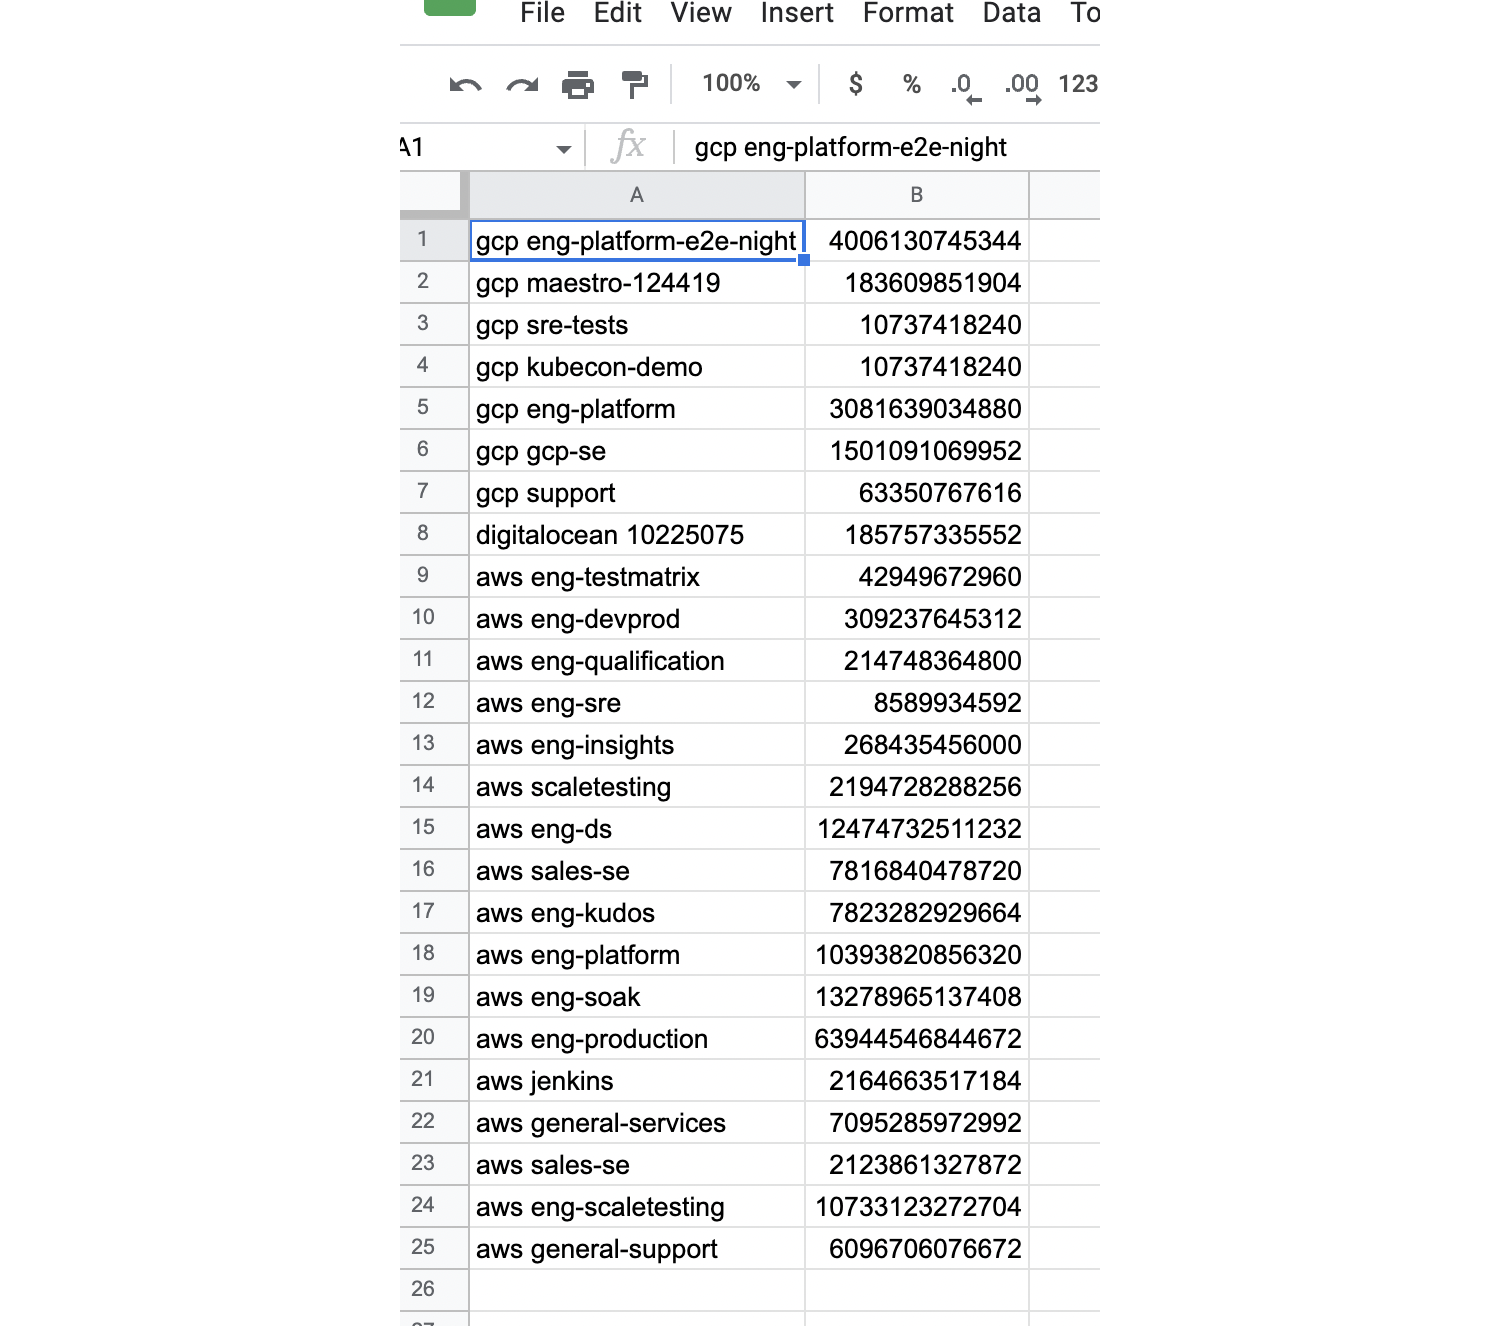
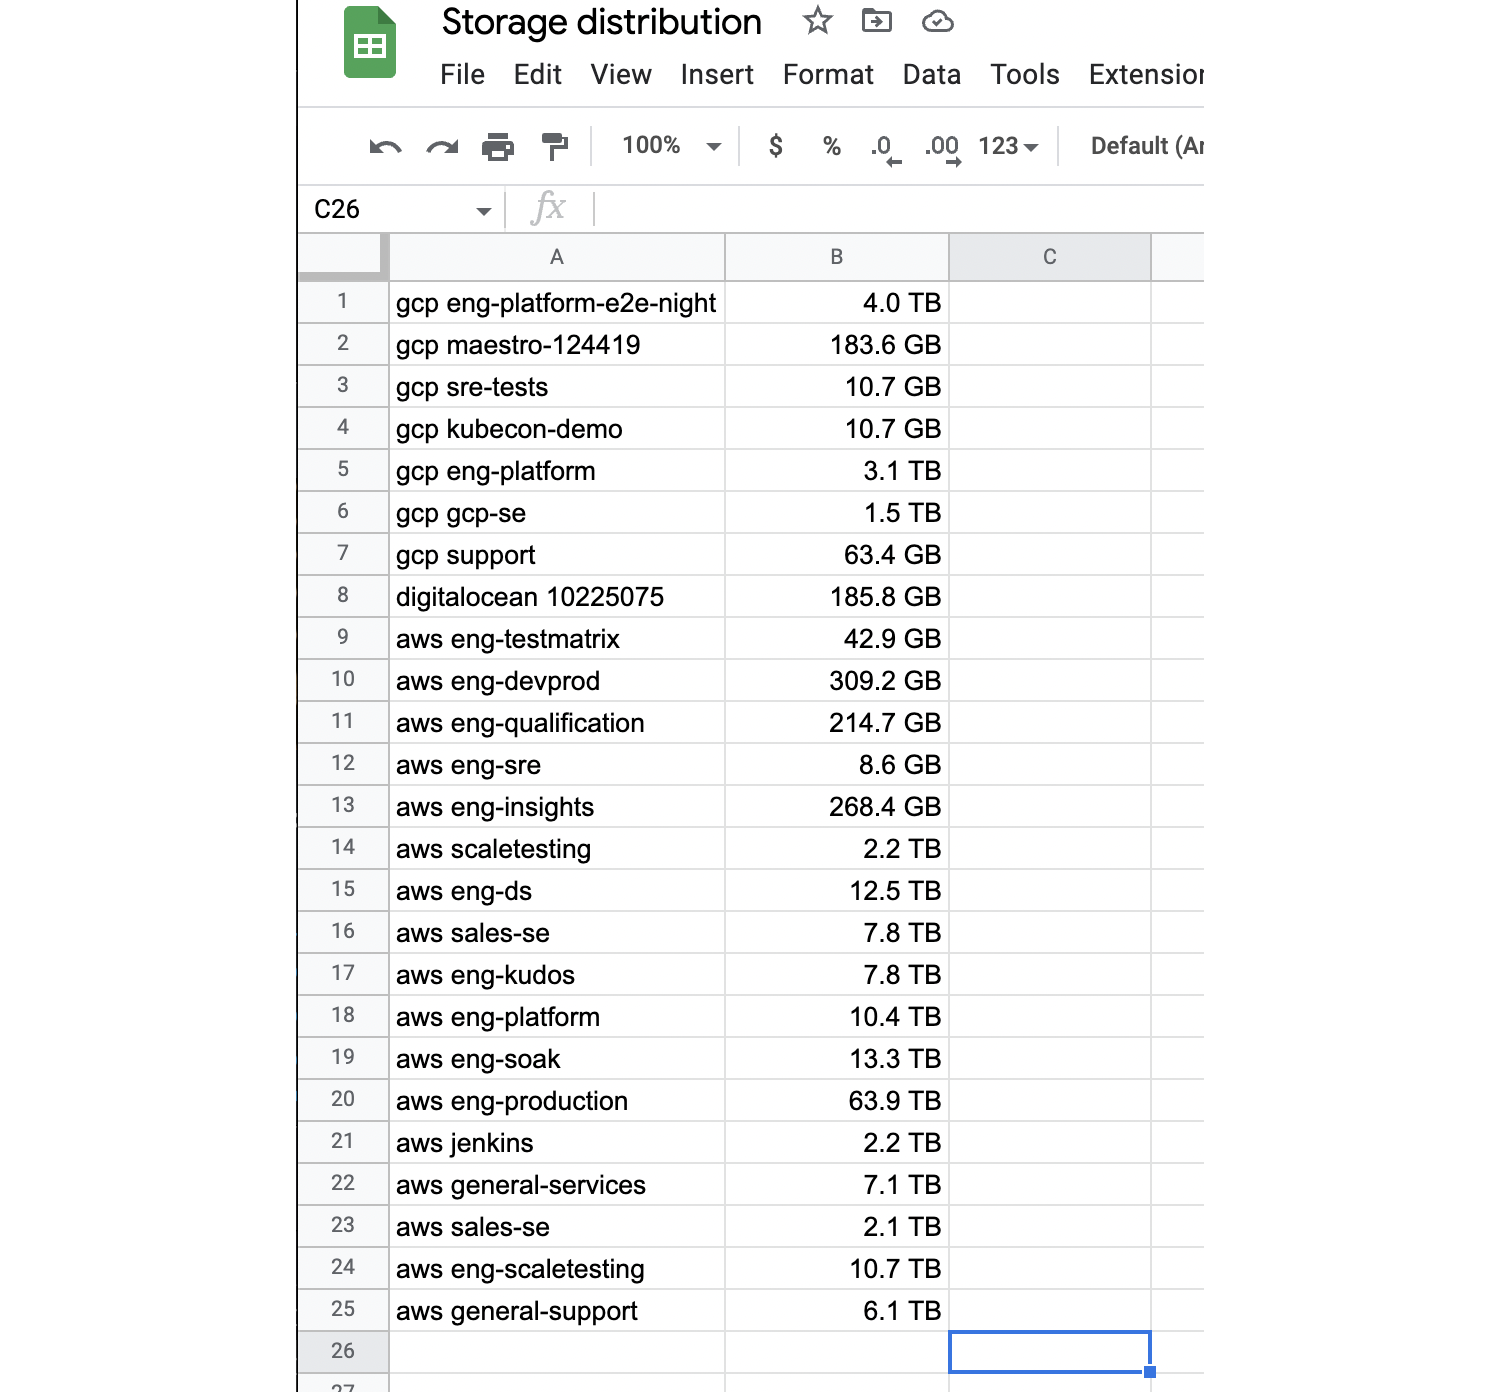
The imported data will be displayed in the sheet:
-
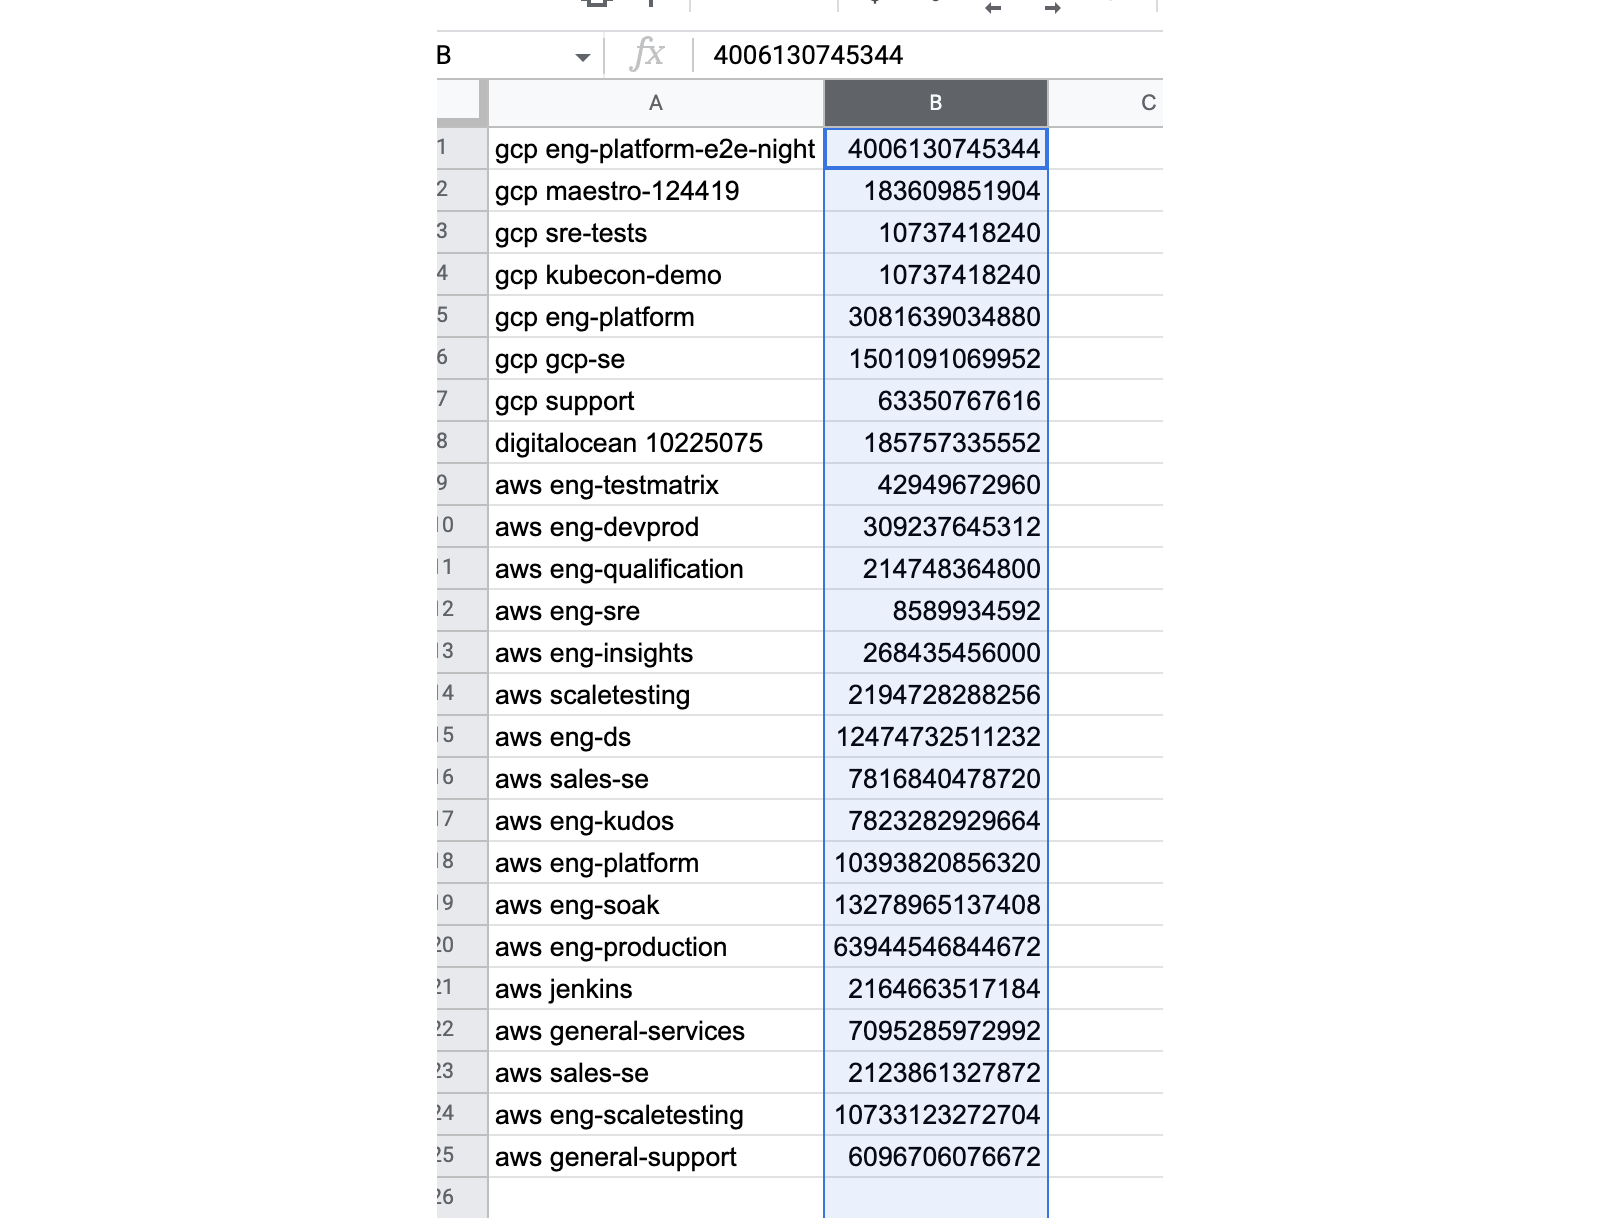
Select column B:
-
In the Format menu, select Number > Custom number format:

-
Enter
[<1000000000]0.00,," MB";[<1000000000000]0.0,,," GB";0.0,,,," TB"and click Apply: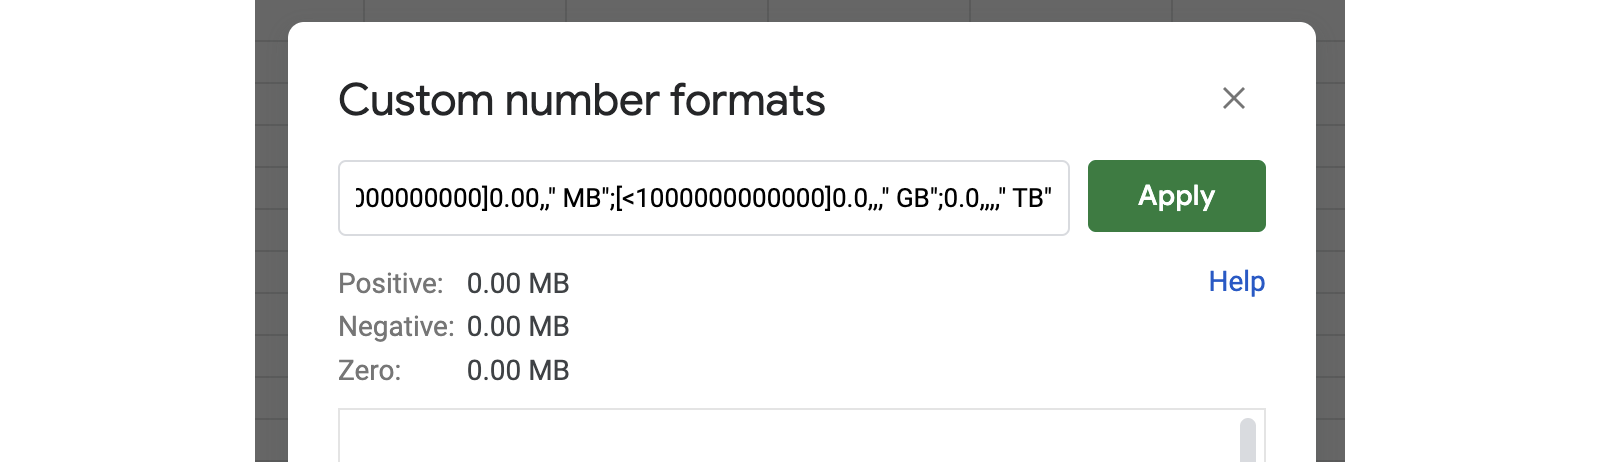
The size column should now be formatted as MB, GB, or TB:
-
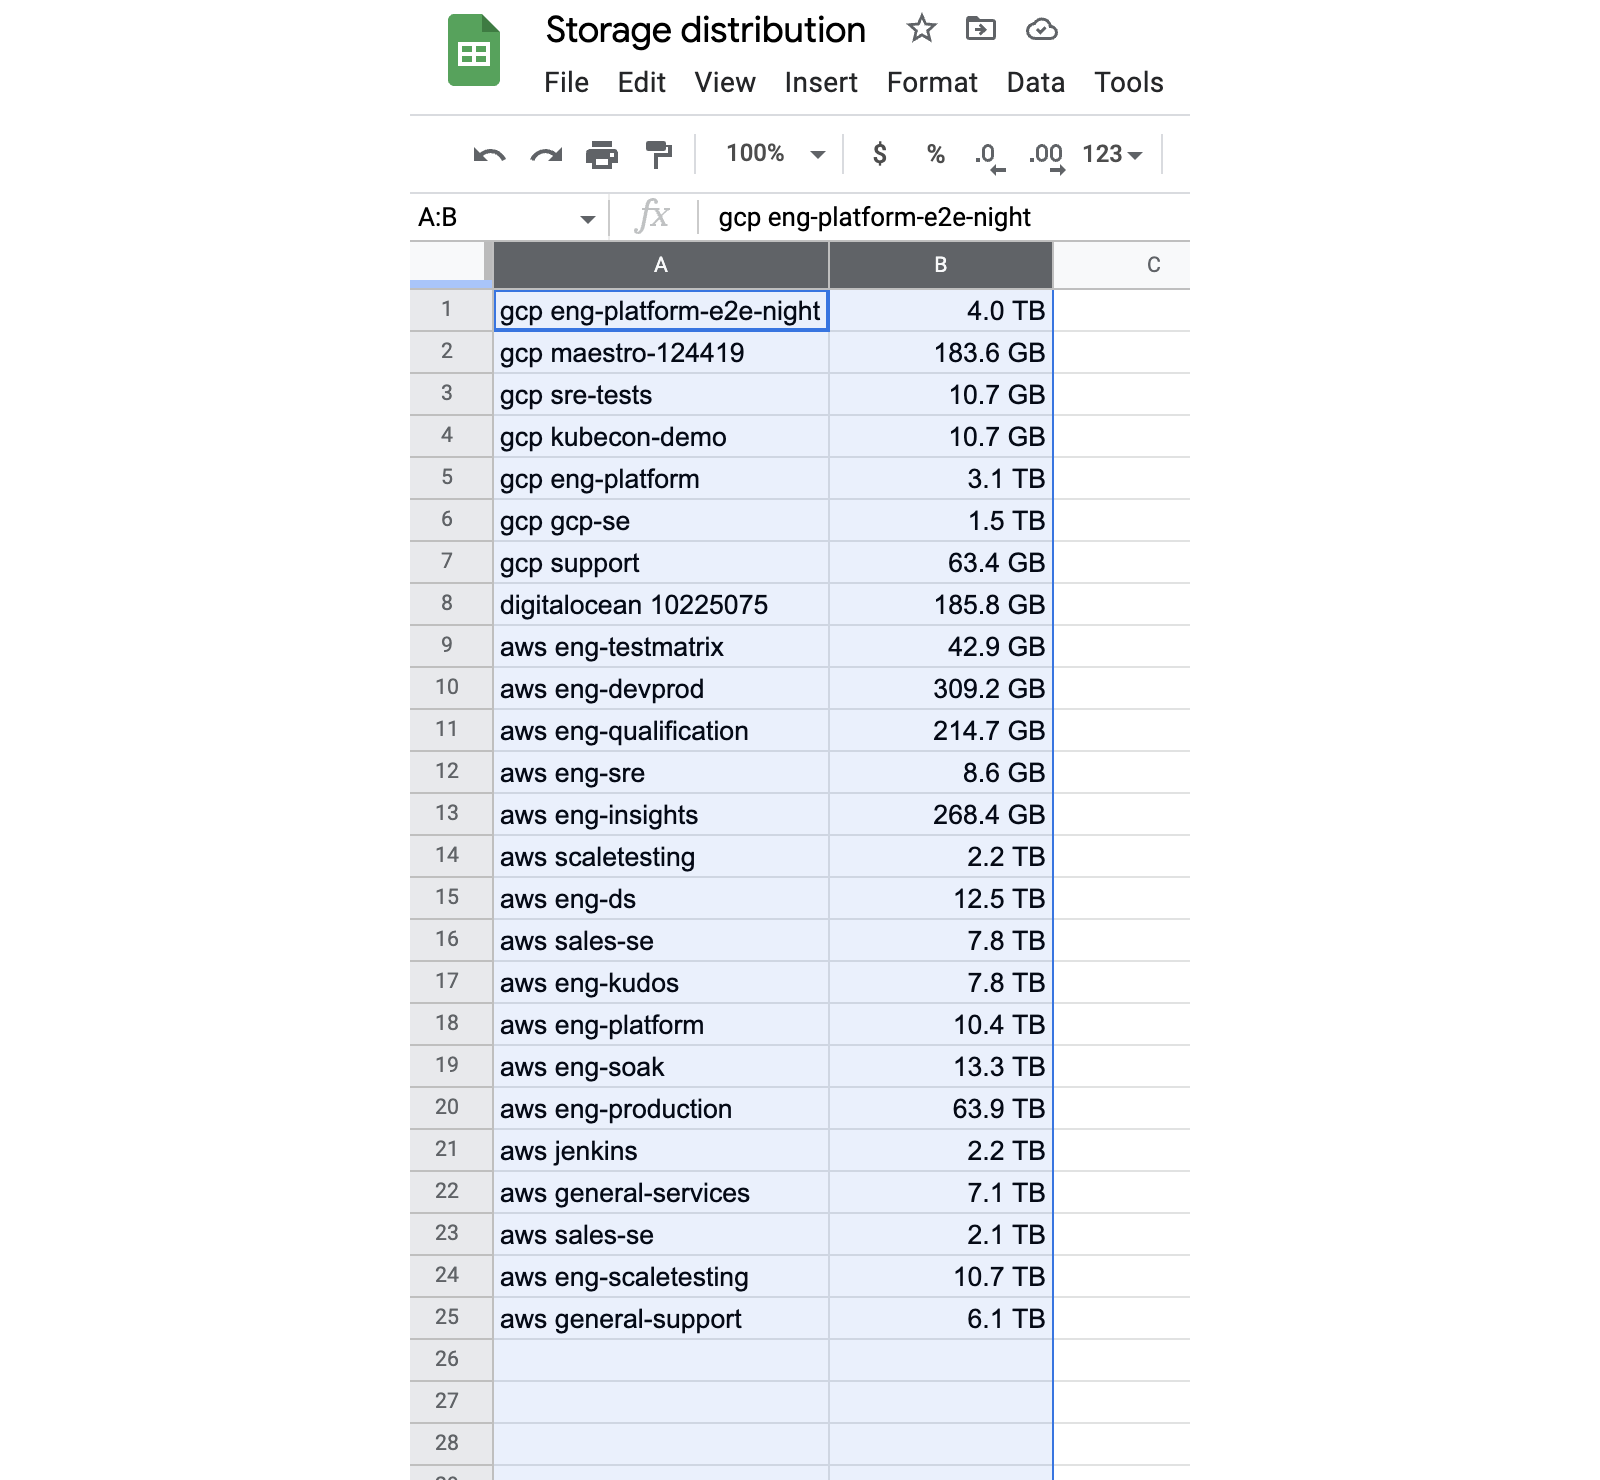
Select both columns A and B:
-
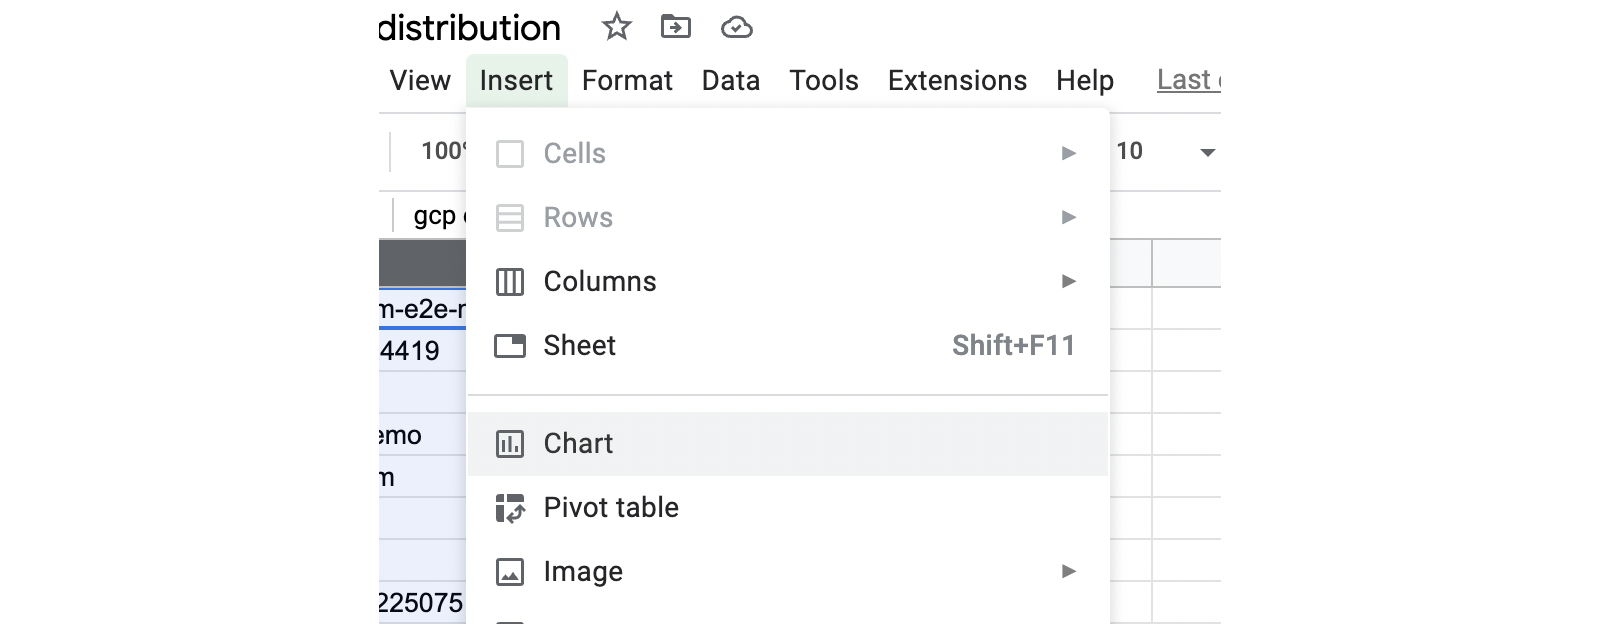
In the Insert menu, select Chart:
-
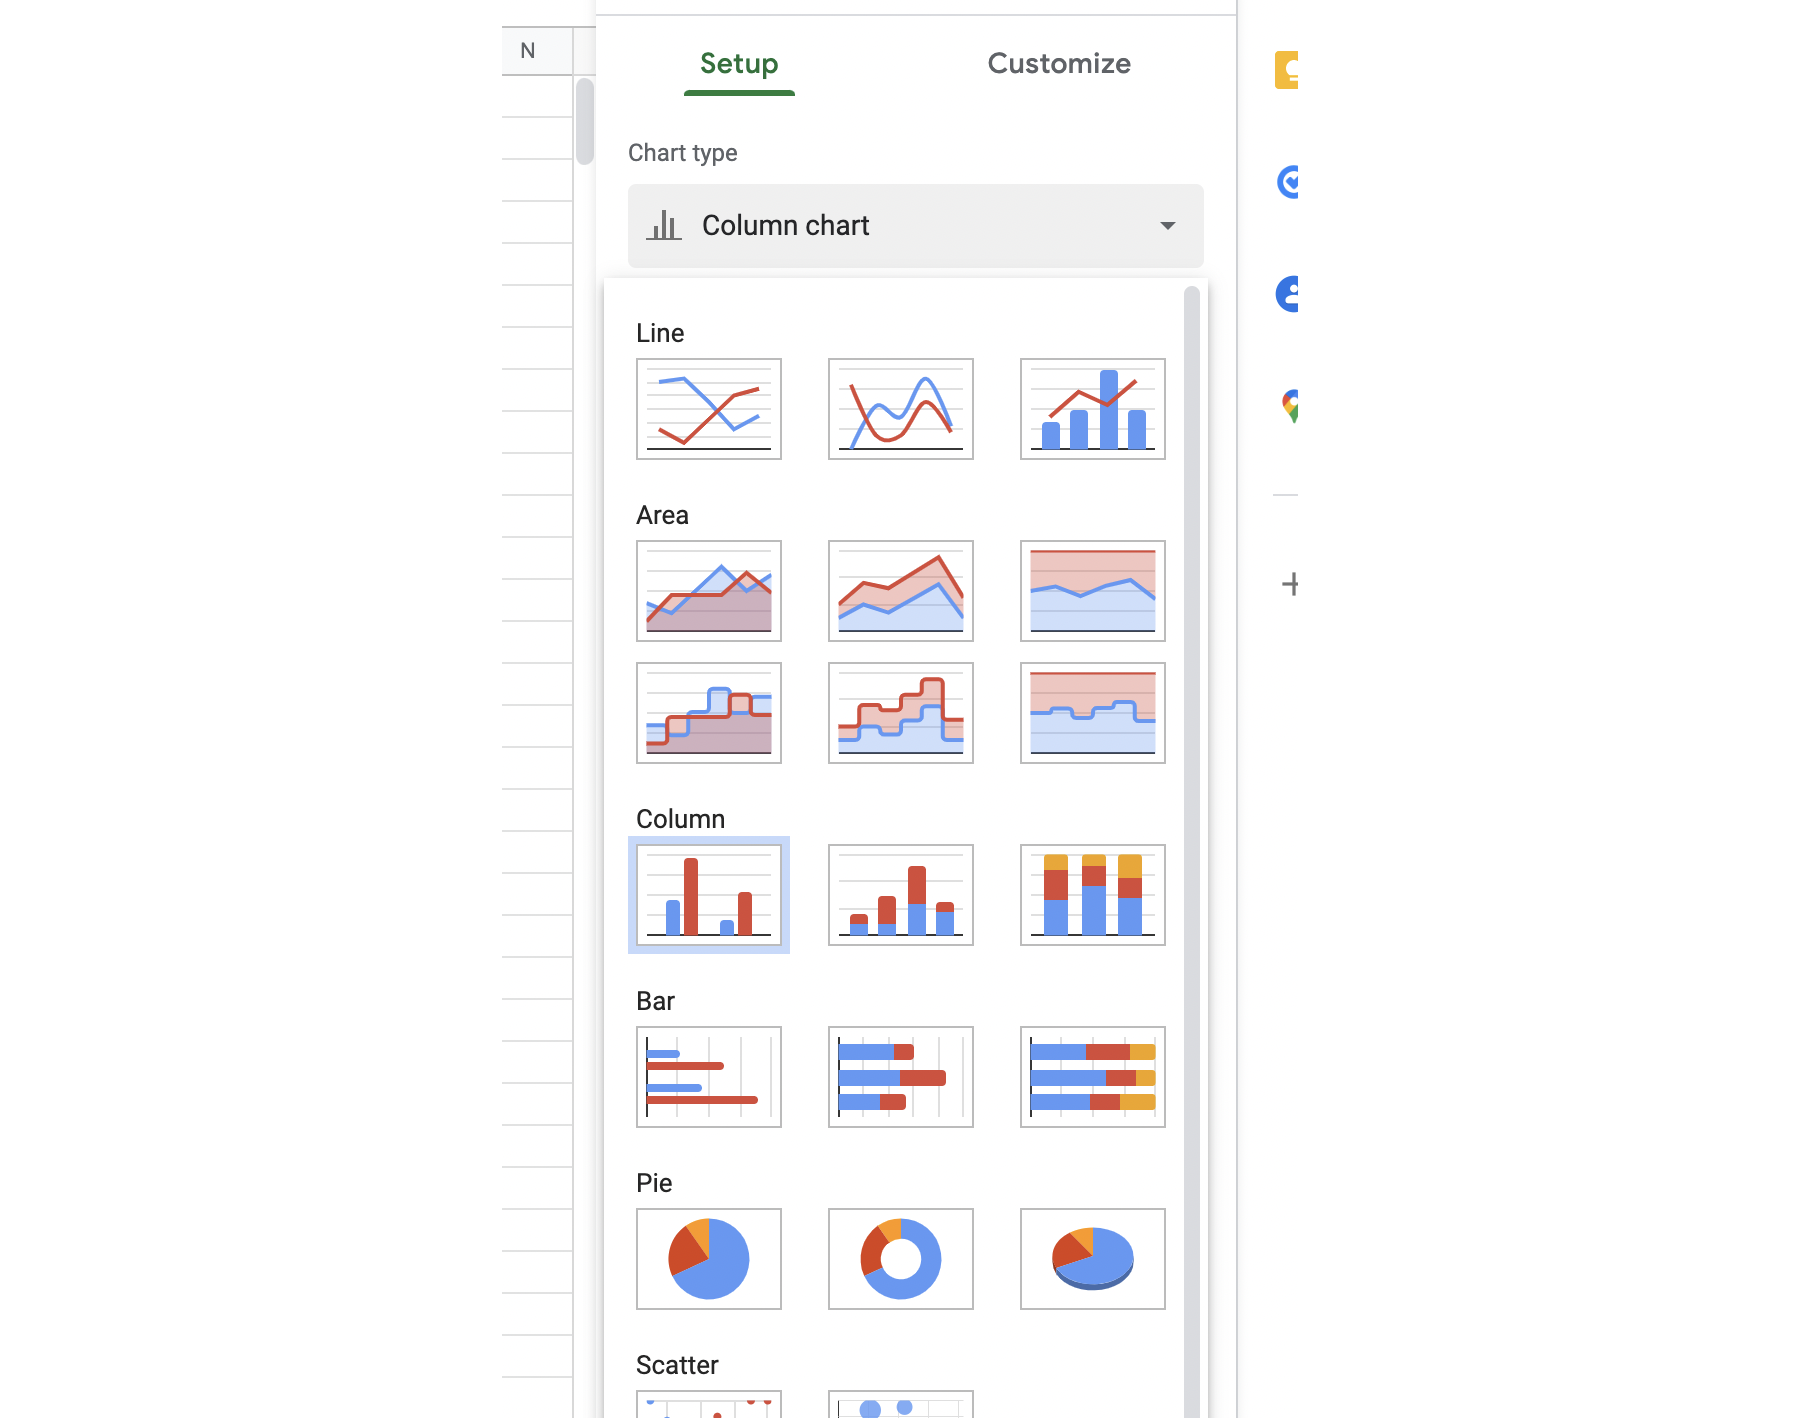
Double-click on the new chart object to open its settings. In the Setup tab, select Pie for Chart type:
-
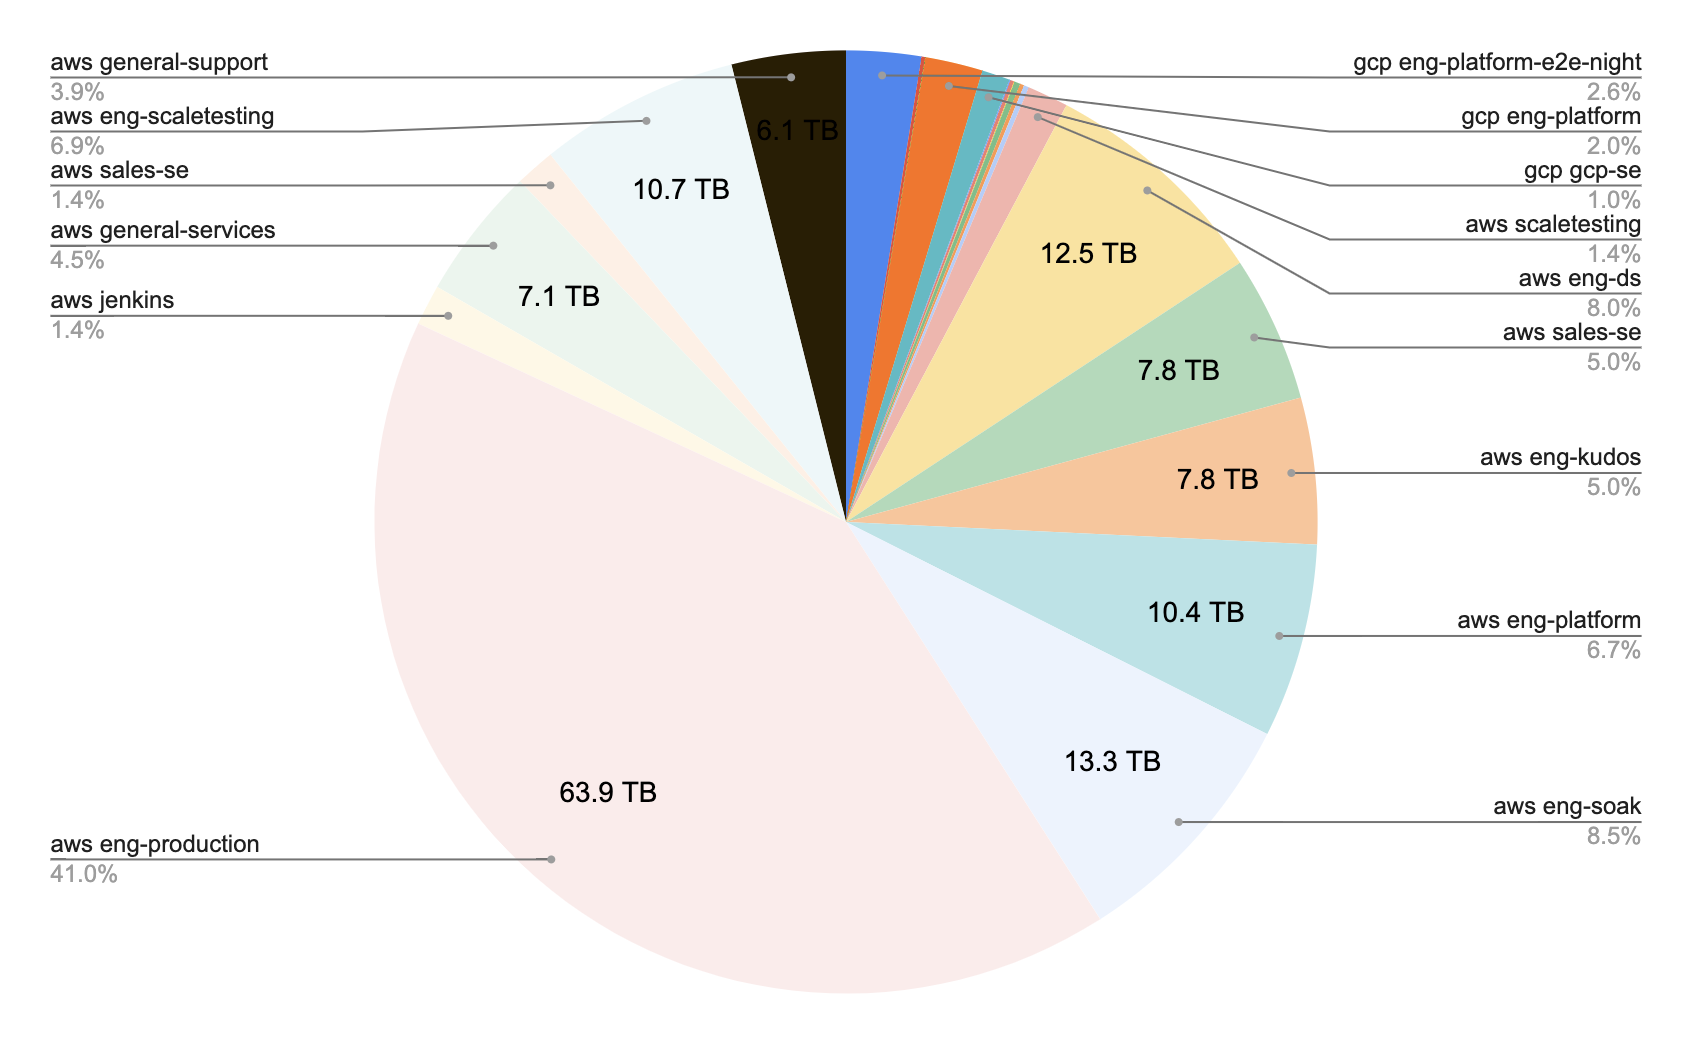
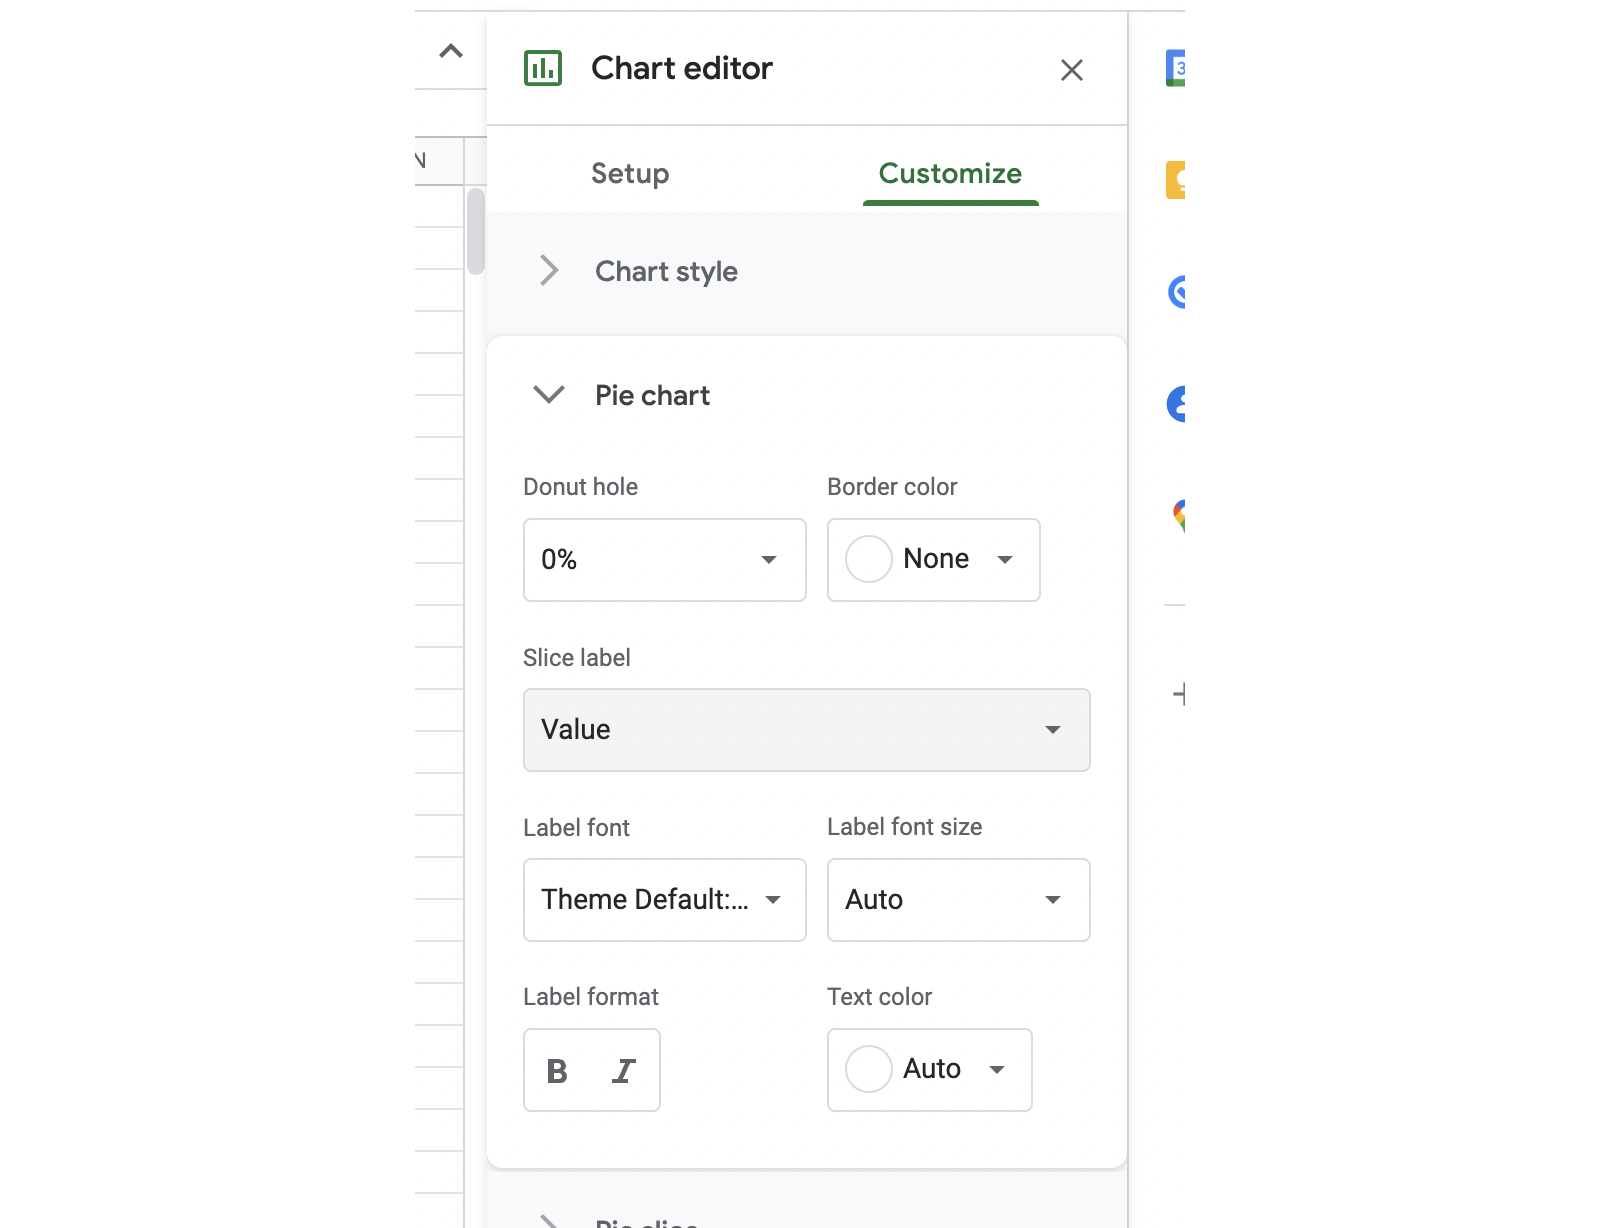
In the Customize tab, expand Pie chart and select Value for Slice label:
We now have a chart showing how storage usage is distributed between cloud accounts: