Actionable Cloud Infrastructure Metrics

Understanding what's running in your cloud infrastructure is important for a number of reasons—for example, security, compliance, and cost.
But sometimes, the cloud feels more like a black box that you're feeding with cash, and in turn it performs the work that makes your business run.

Even those spinning up cloud resources might only be aware of their small slice of the pie. With hundreds of thousands of interconnected resources, it is really hard to know what's going on!
Cloud inventory has become a new type of technical debt, where organizations lose track of their infrastructure and how it relates to the business. Resoto helps to break open the aforementioned black box and eliminate inventory debt.
Resoto provides a searchable snapshot of the current state of your cloud infrastructure, and can automatically react to state changes. Resoto also allows you to aggregate and visualize this data.
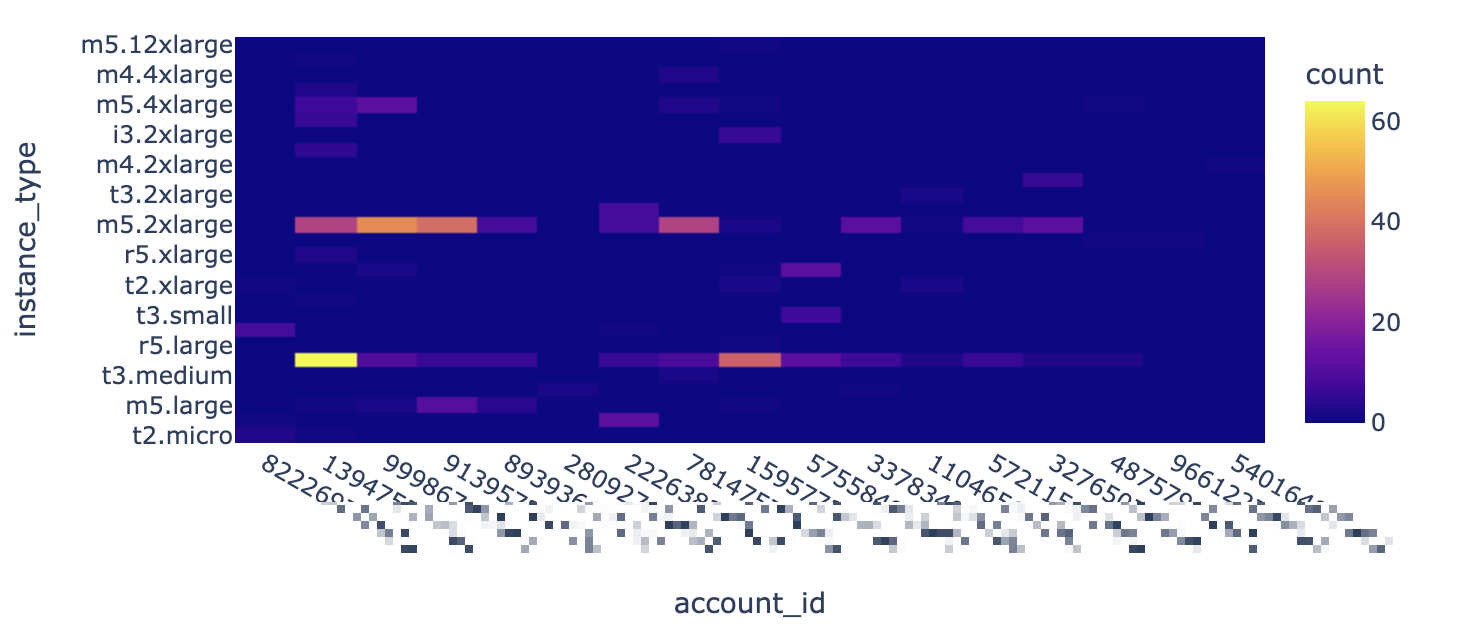
Here's an example of a heatmap that allows you to immediately see outliers (like when an account suddenly starts using a large number of expensive, high-core-count instances):
We can ingest this aggregated data into a time series database, such as Prometheus. This information can then be used to build diagrams illustrating cloud resources (e.g., compute instances and storage) over time.
This allows you to alert on trends—for example, if you are projected to exceed a quota or spend limit.
Another use case is to quickly identify anomalies using the 3σ rule. If cloud API credentials are leaked or an automated system goes haywire, you would immediately see the spike instead of receiving an unpleasant surprise on your next cloud bill. Best of all, it works across multiple clouds and accounts!
Resoto comes with a handy metrics component, Resoto Metrics, which takes aggregation results and exports them to Prometheus. This blog post describes how to define your own metrics, write some PromQL queries and build a simple metrics dashboard using Resoto Metrics, Prometheus, and Grafana.
Concepts and Terminology
If you are already familiar with graph and time series databases, metrics, samples, labels, Prometheus, and Grafana, please feel free to skip ahead. For those new to the cloud-native metrics ecosystem, let's get some concepts and terminology out of the way!
Collect
Resoto creates an inventory of your cloud infrastructure by storing the metadata of your cloud resources inside of a graph. This is what we call the collect step.
Each resource (e.g., compute instance, storage volume, security group, etc.) is represented by a graph node. Nodes are connected via edges.
Edges represent the relationship between two nodes, like so (please excuse my MS Paint skills):
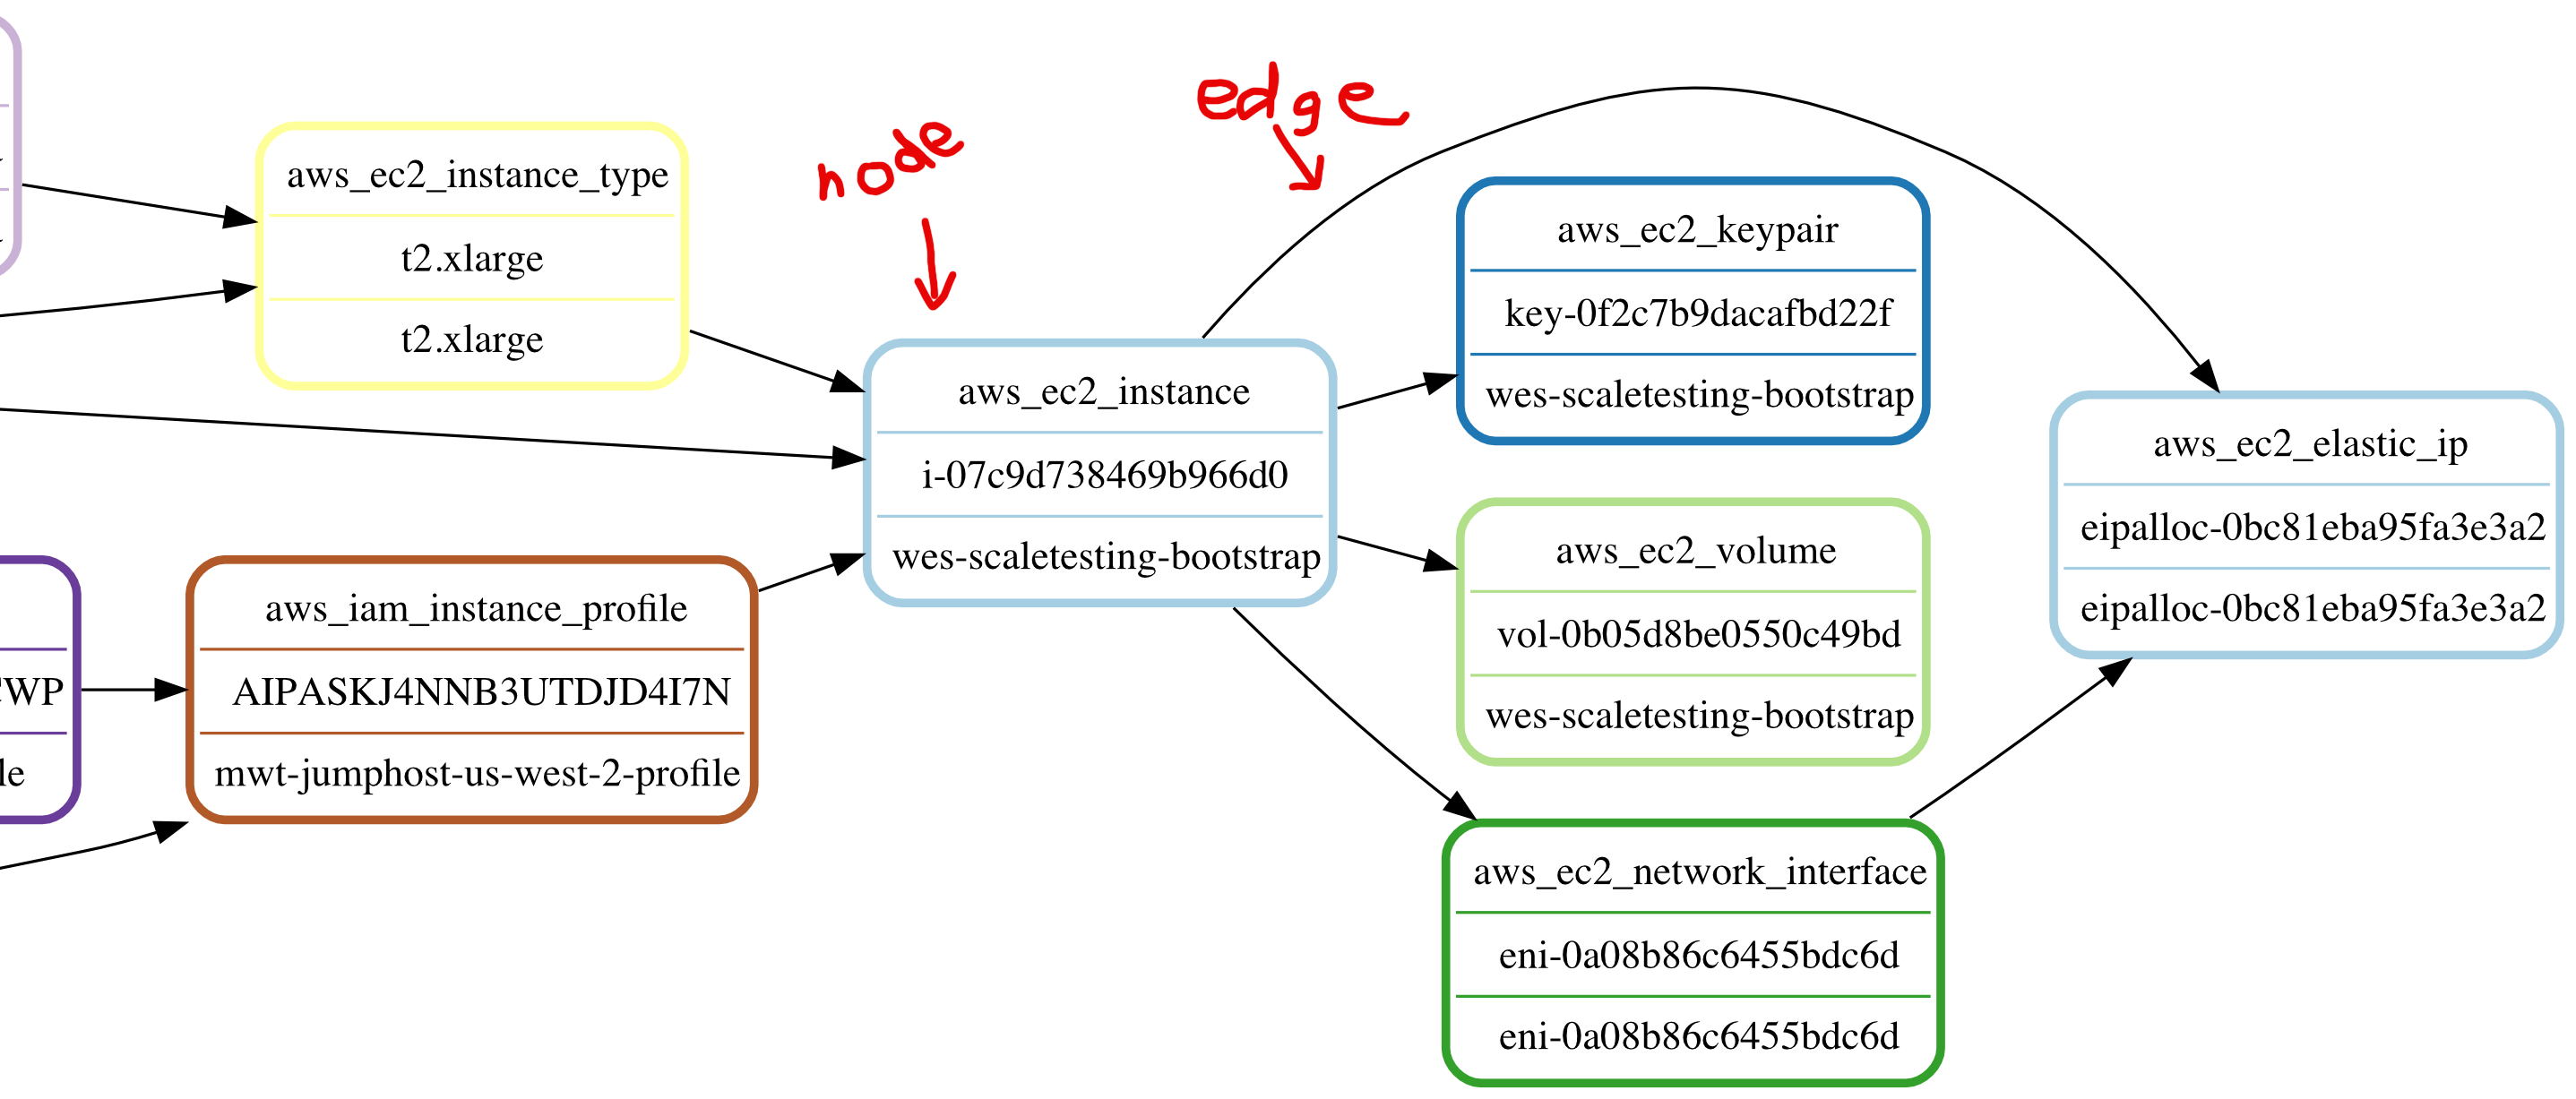
A node is essentially an indexed JSON document containing the metadata of a resource. The aws_ec2_instance from the graph picture above would look something like this:
{
  "reported": {
    "kind": "aws_ec2_instance",
    "id": "i-07c9d738469b966d0",
    "tags": {
      "owner": "lukas"
    },
    "name": "wes-scaletesting-bootstrap",
    "ctime": "2020-06-16T15:08:45Z",
    "instance_cores": 4,
    "instance_memory": 16,
    "instance_type": "t2.xlarge",
    "instance_status": "running",
    ...
  },
  ...
}
Search
Among other things, Resoto allows you to search this metadata. Here's an example:
> search is(aws_ec2_instance) and instance_cores > 4
kind=aws_ec2_instance, id=i-065af67d77cd5a272, name=16ca1.prod1, instance_cores=16, age=3yr2mo, cloud=aws, account=eng-production, region=us-west-2
kind=aws_ec2_instance, id=i-019f3f3a2a8d1990e, name=16ca2.prod1, instance_cores=16, age=3yr2mo, cloud=aws, account=eng-production, region=us-west-2
kind=aws_ec2_instance, id=i-0667dc8de49a4319e, name=16ca3.prod1, instance_cores=16, age=3yr2mo, cloud=aws, account=eng-production, region=us-west-2
kind=aws_ec2_instance, id=i-076b9763c755a9b51, name=16ca4.prod1, instance_cores=16, age=3yr2mo, cloud=aws, account=eng-production, region=us-west-2
kind=aws_ec2_instance, id=i-074fcfe526f95c9fd, name=16ca5.prod1, instance_cores=16, age=3yr2mo, cloud=aws, account=eng-production, region=us-west-2
kind=aws_ec2_instance, id=i-04e09d3c714048c4d, name=16ca6.prod1, instance_cores=16, age=3yr2mo, cloud=aws, account=eng-production, region=us-west-2
kind=aws_ec2_instance, id=i-0d2dfda13e02b2b20, name=16ca7.prod1, instance_cores=16, age=2yr9mo, cloud=aws, account=eng-production, region=us-west-2
...
The search returned a list of all EC2 instances with more than 4 cores. There are times when you may not be interested in the details of individual resources, but simply want to aggregate them. You may want to know the total number of resources, or the number of running resources of a particular kind. You may be interested in the distribution of compute instances by instance type (e.g., m5.large, m5.2xlarge, etc.), or the current cost of compute and storage grouped by team.
Aggregation
Aggregating and grouping search results creates the samples of a metric.
> search aggregate(/ancestors.cloud.reported.name as cloud, /ancestors.account.reported.name as account, /ancestors.region.reported.name as region, instance_type as type, instance_status as status: sum(1) as instances_total): is(instance)
group:
cloud: aws
account: eng-production
region: us-west-2
type: m5.xlarge
status: running
instances_total: 13
---
group:
cloud: aws
account: eng-production
region: us-west-2
type: m5.4xlarge
status: stopped
instances_total: 7
...
This is useful, but the ability to compare current values to those from an hour, day, month, year, etc. ago would be even more useful. This brings us to the next concept, time series.
Time Series
Time series databases such as Prometheus do not store details of individual resources, but aggregated data over time—allowing us to query aggregate data and create charts to visualize the results.
In the aggregated search above, each result is what Prometheus calls a sample. A sample is a single value at a specific point in time.
Looking again at the same example, cloud, account, region, type, and status in each group are labels. Labels are key: value pairs that allow us to group samples.
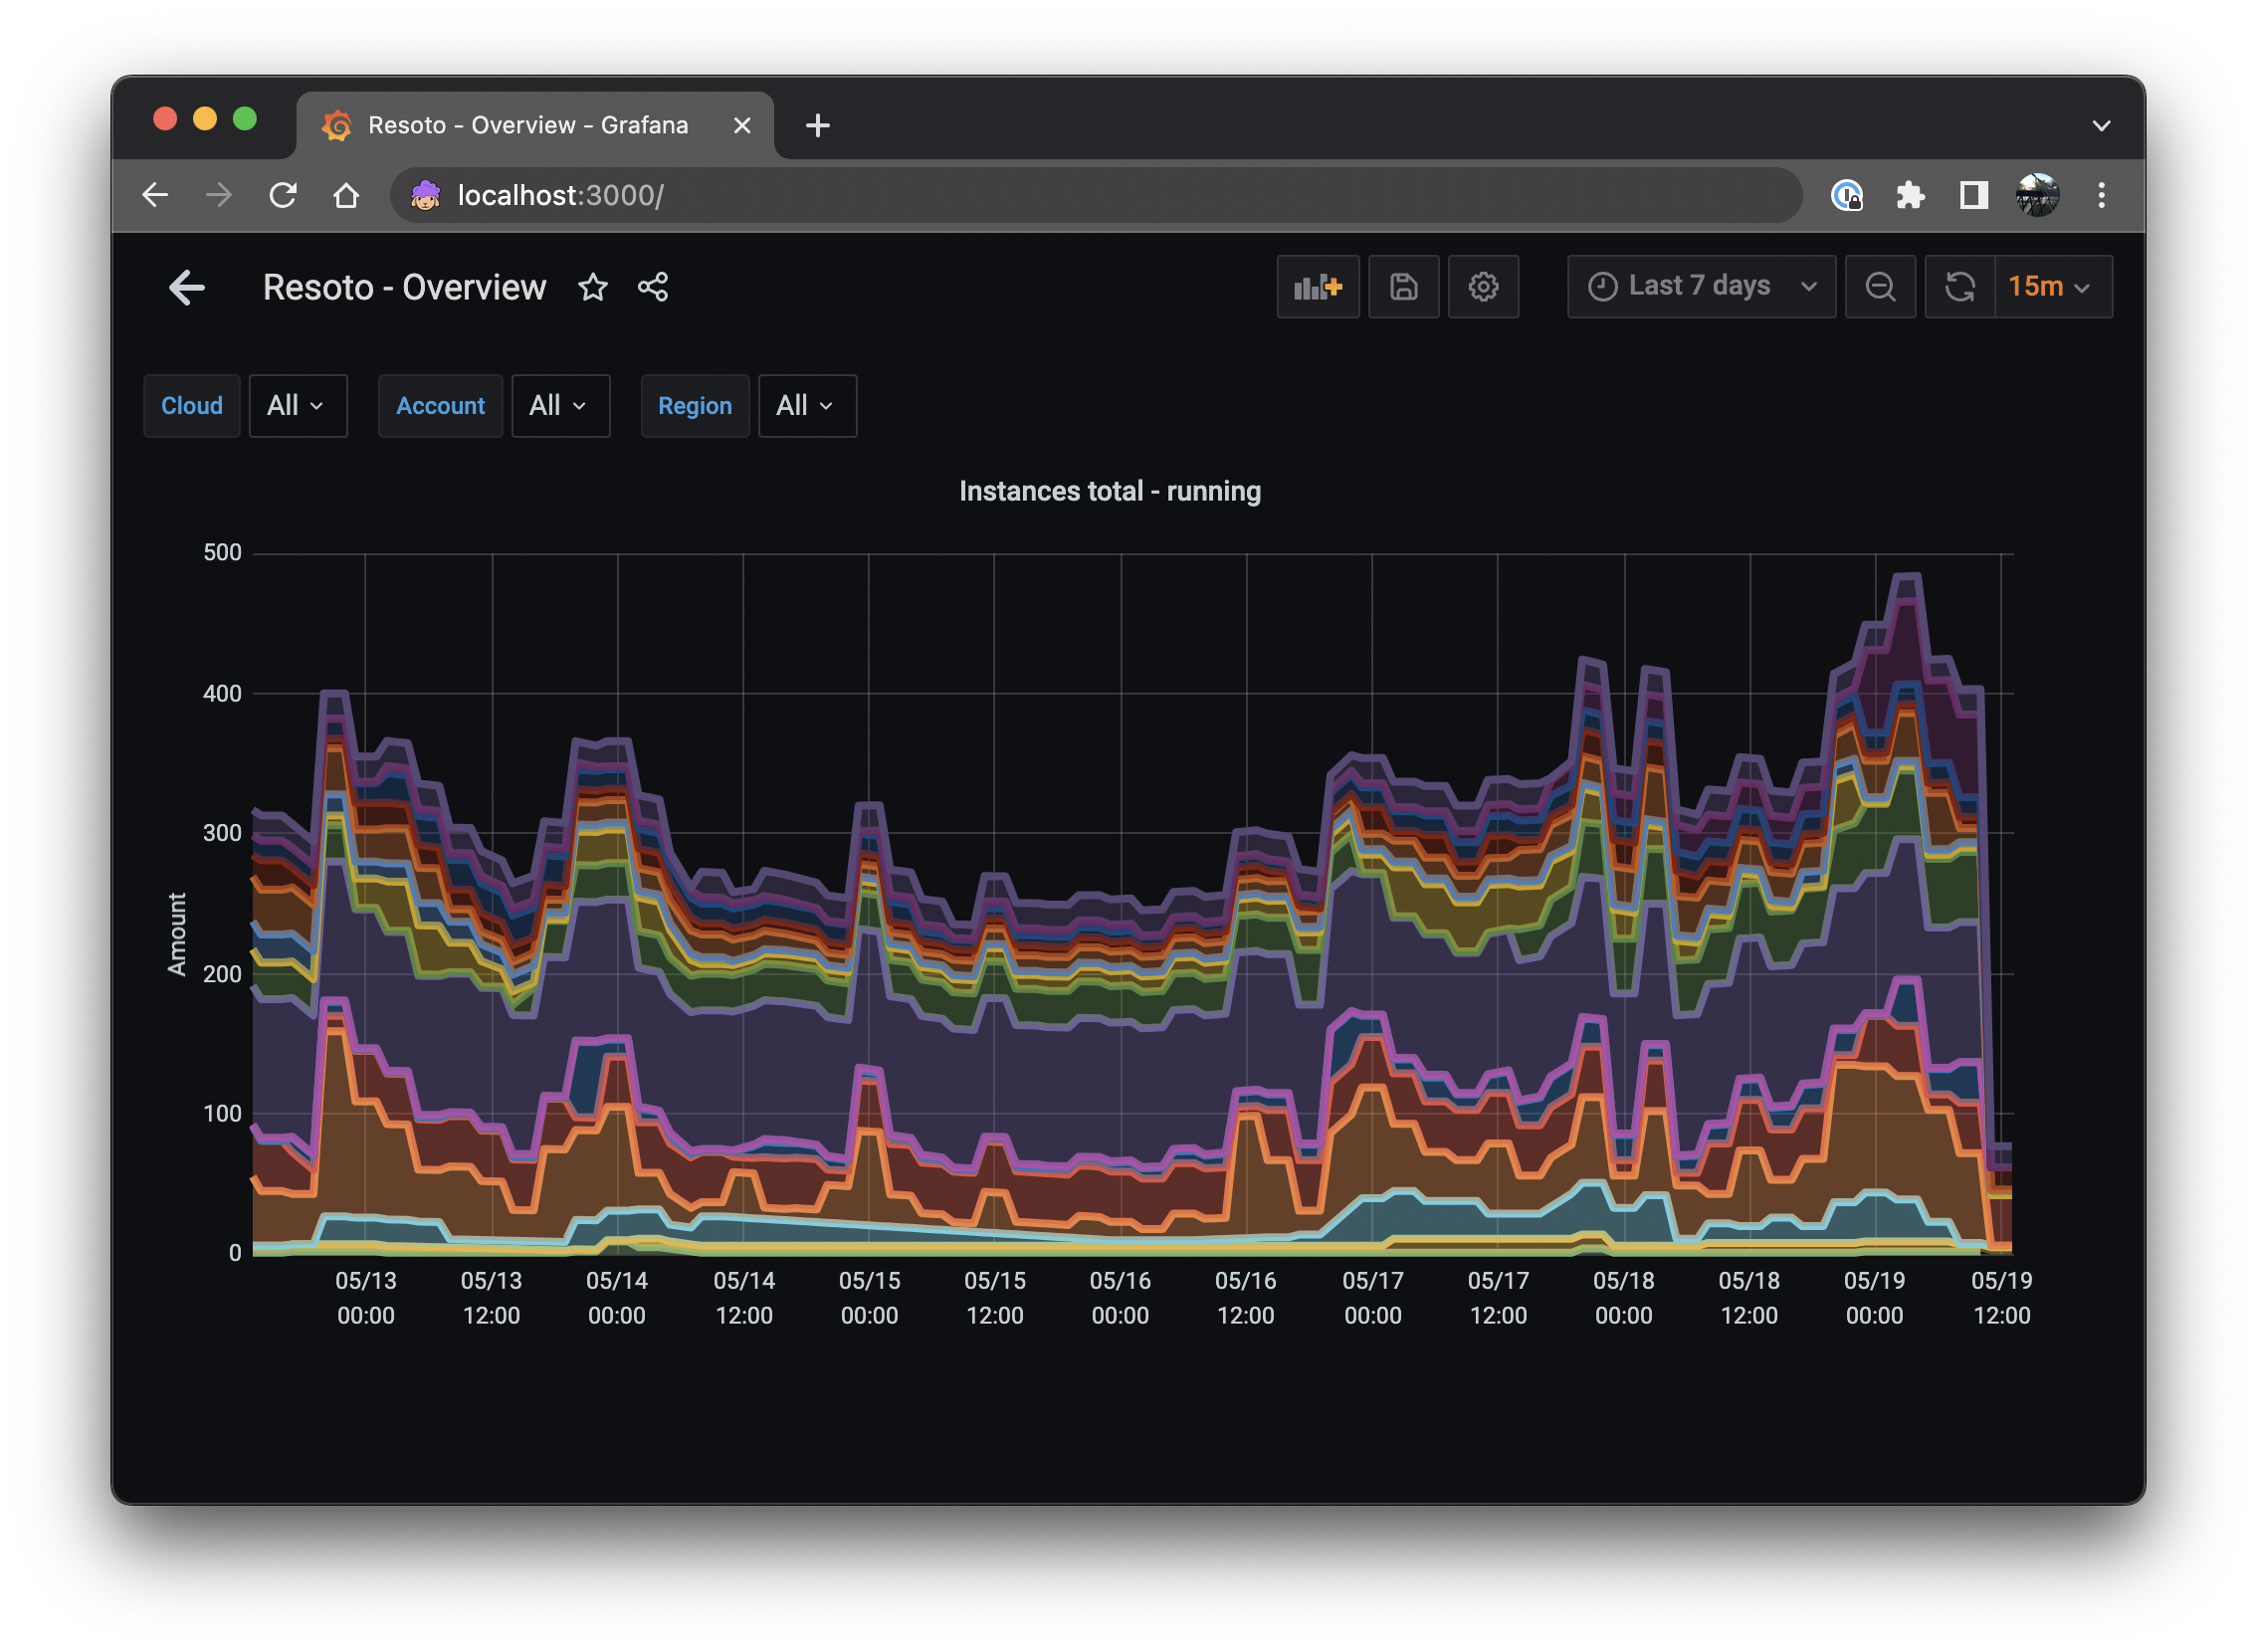
Prometheus has basic graphing capabilities, but Grafana allows you to build a dashboard visualizing data from different sources in a variety of chart styles, like this stacked line chart:
So here's the plan. First we will learn how to configure Prometheus to fetch data from Resoto Metrics. Then how to query that data inside Prometheus. After that we explore from where Resoto retrieves its metrics configuration and how to define our own metrics. Finally we will use Grafana to create a simple dashboard and visualize the data.
Getting Started
If you are new to Resoto, start the Resoto stack and configure it to collect your cloud accounts.
To check out the data Resoto Metrics generates open https://localhost:9955/metrics in your browser (replacing localhost with the IP address or hostname of the machine where resotometrics is running). This data is updated whenever Resoto runs the collection workflow. You should see an output similar to this:
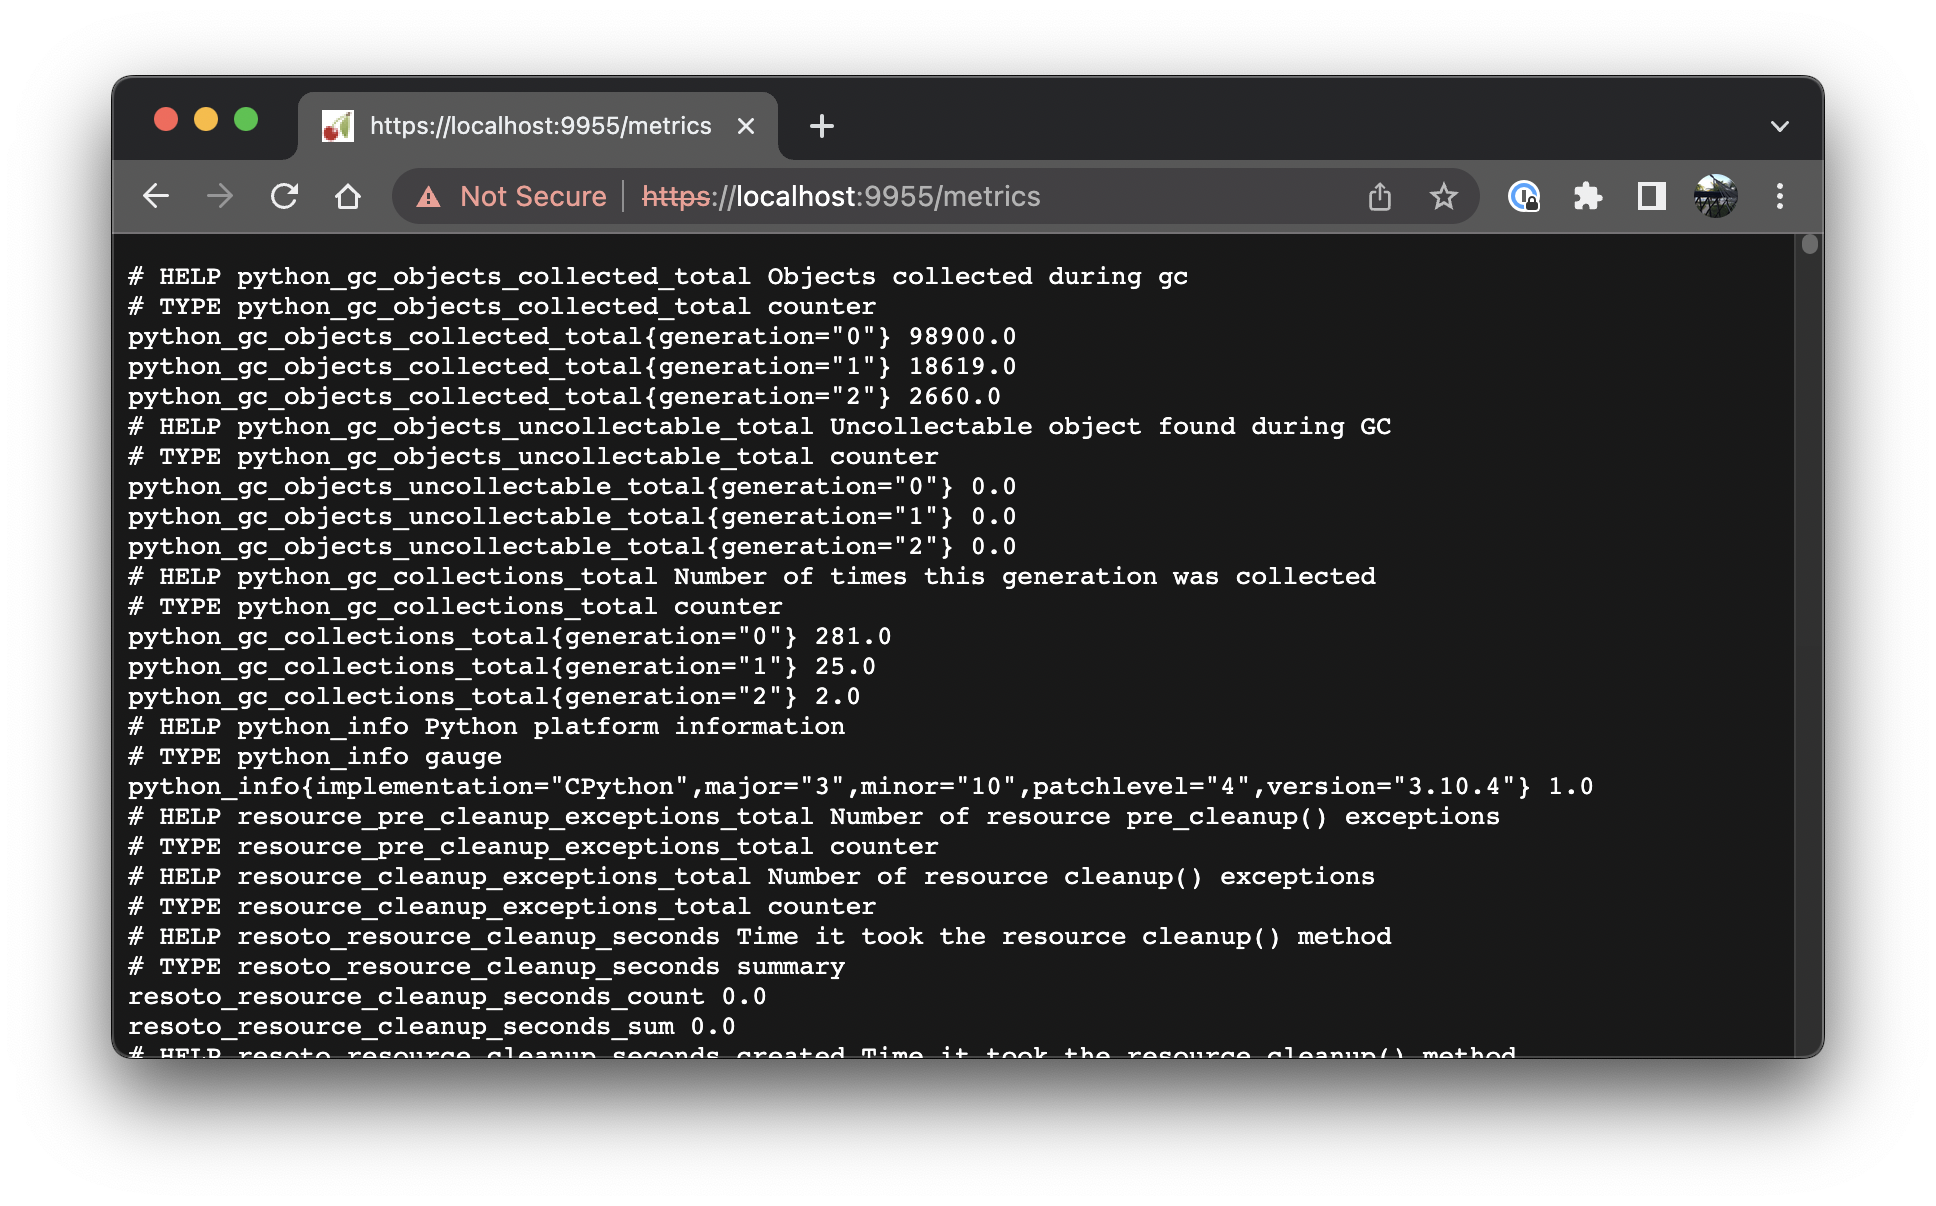
That is the raw metrics data Prometheus will ingest. If you are using our Docker stack you do not have to do anything, Prometheus is already pre-configured. If you are using your own Prometheus installation, configure it to scrape this metrics endpoint. The config will look something like this:
scrape_configs:
  - job_name: "resotometrics"
    scheme: https
    tls_config:
      insecure_skip_verify: true
    static_configs:
      - targets: ["localhost:9955"]
Instead of skipping verification of the TLS certificate, you can also download the Resoto CA certificate and configure Prometheus to use it.
Querying a Metric
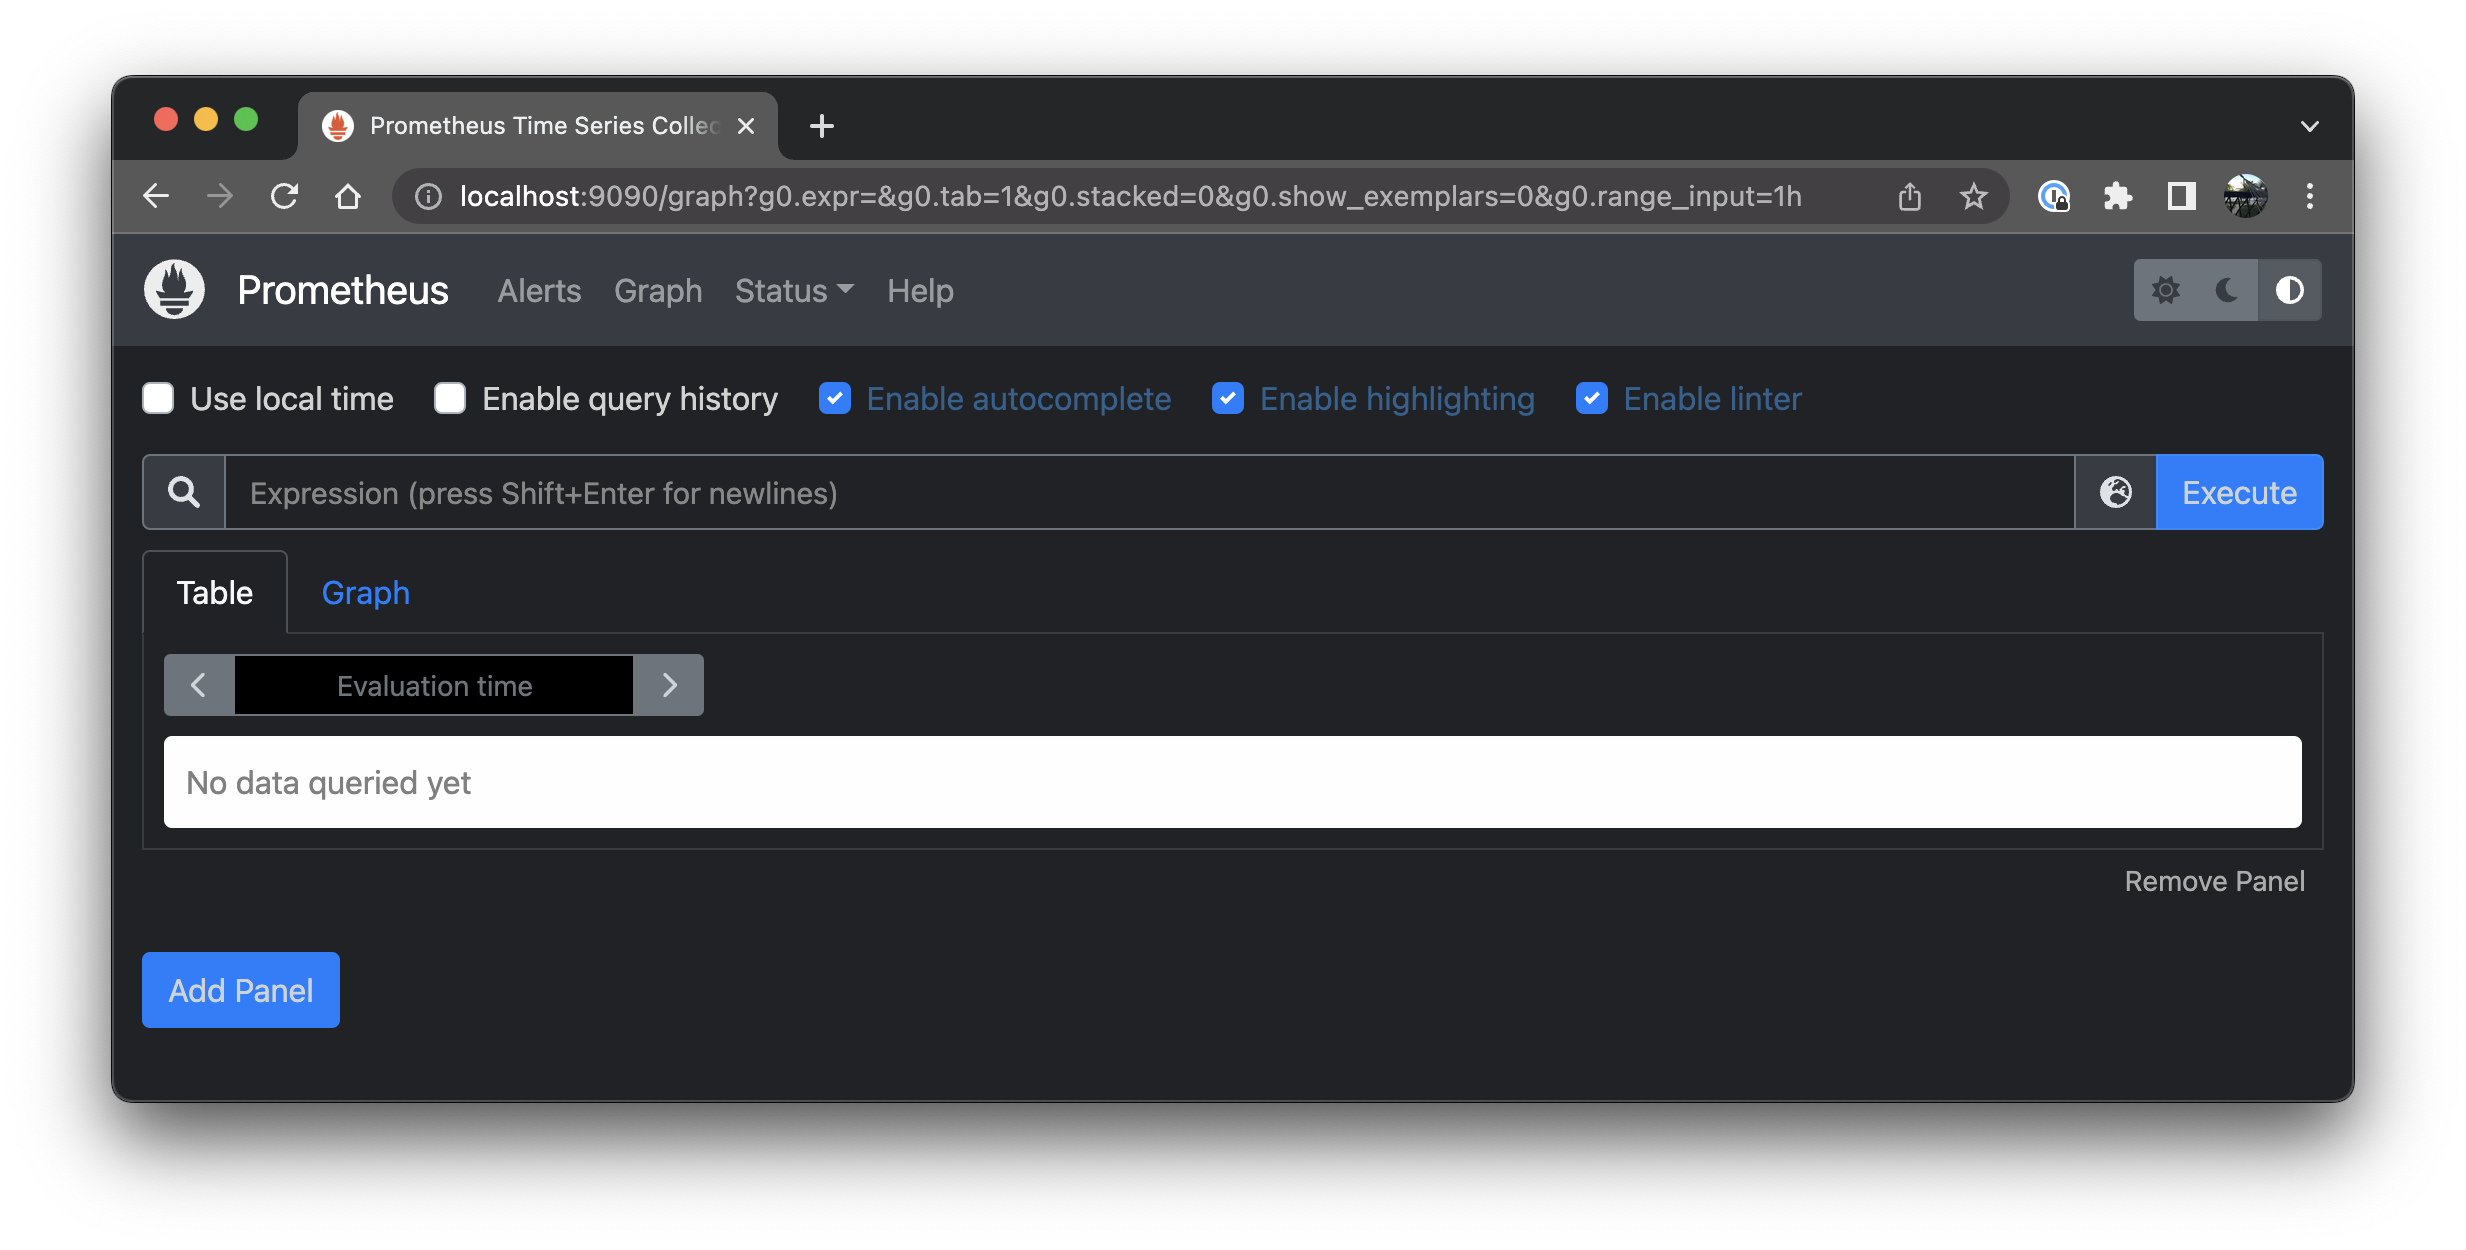
Open up your Prometheus installation (in our Docker stack it is running at http://localhost:9090) and you should see the following:
Let's start with a very simple expression:
resoto_instances_total
That's it, that's the query. If you have any instances collected in Resoto the output will look something like this:
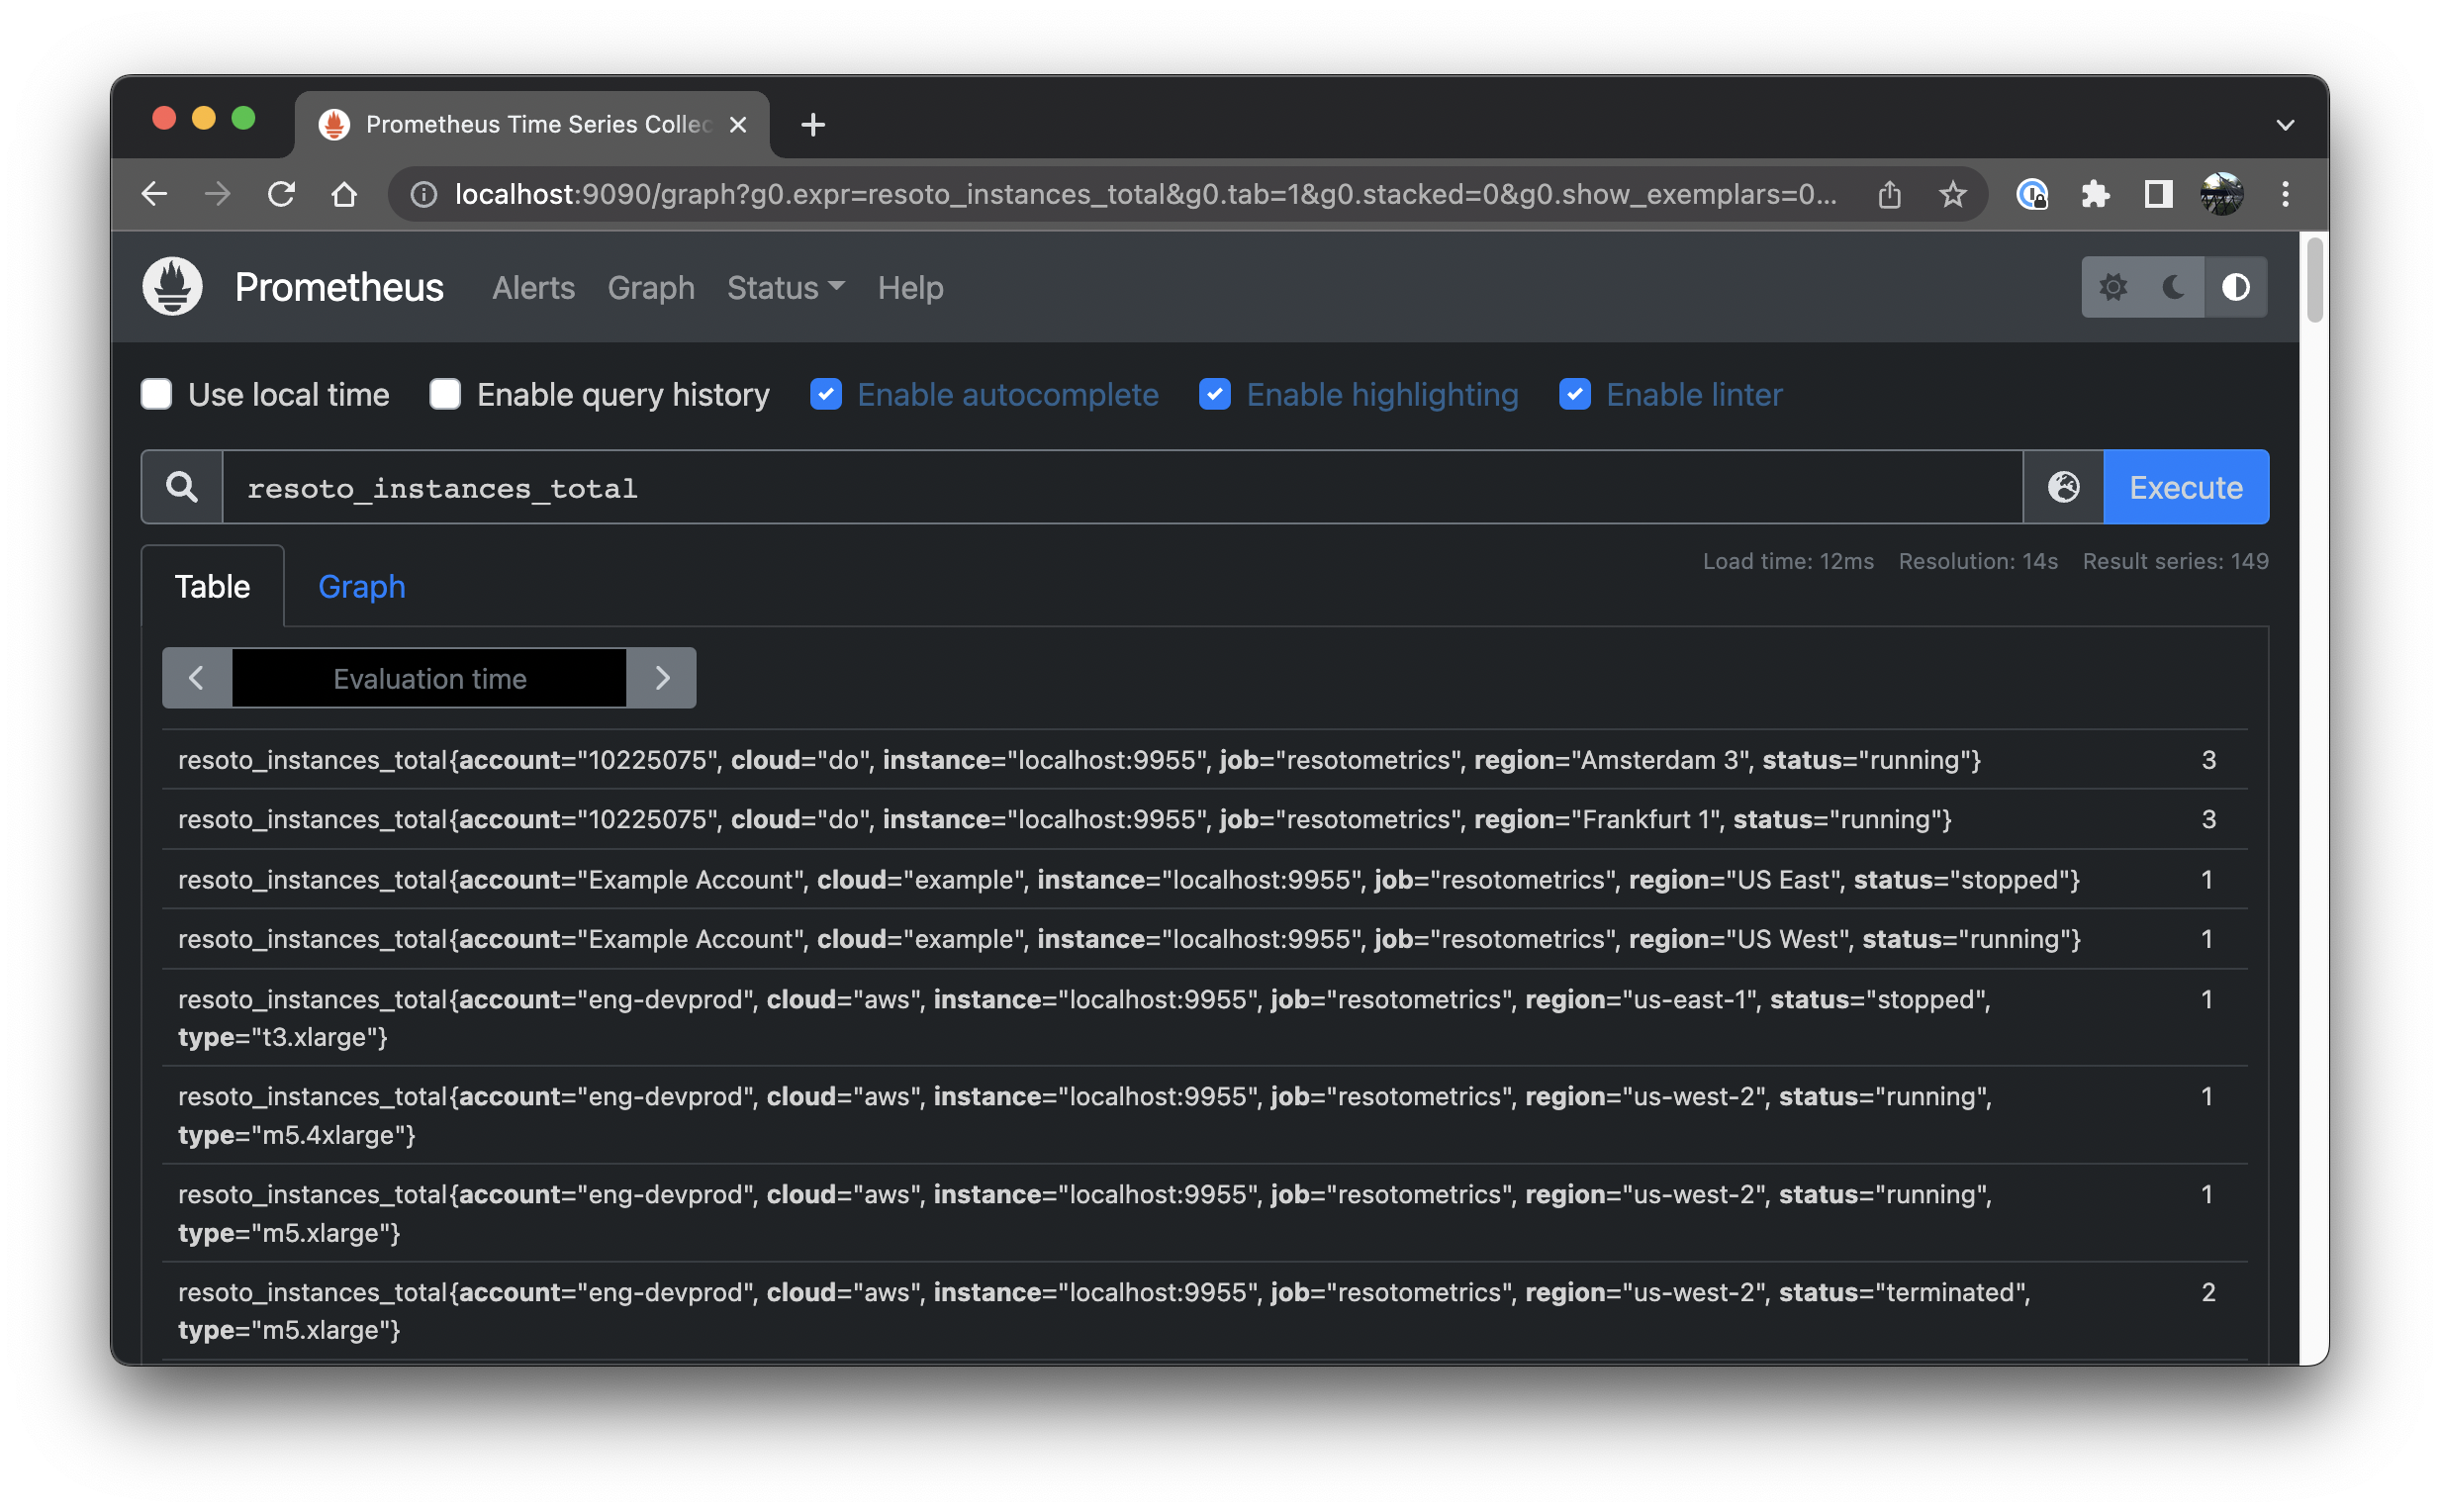
Here is one of those metrics from the list:
resoto_instances_total{cloud="aws", account="eng-production", region="us-west-2", status="running", type="m5.xlarge", instance="localhost:9955", job="resotometrics"} 17
The key="value" pairs inside those curly brackets are those previously mentioned labels. To filter by label let us update the query to:
resoto_instances_total{status="running"}
Now we are only seeing compute instances that we are actually paying for at the moment.This information is a bit more interesting, but we could get the same from within the Resoto Shell. What would be really interesting, is how the number of compute instances has changed over the last week or two.
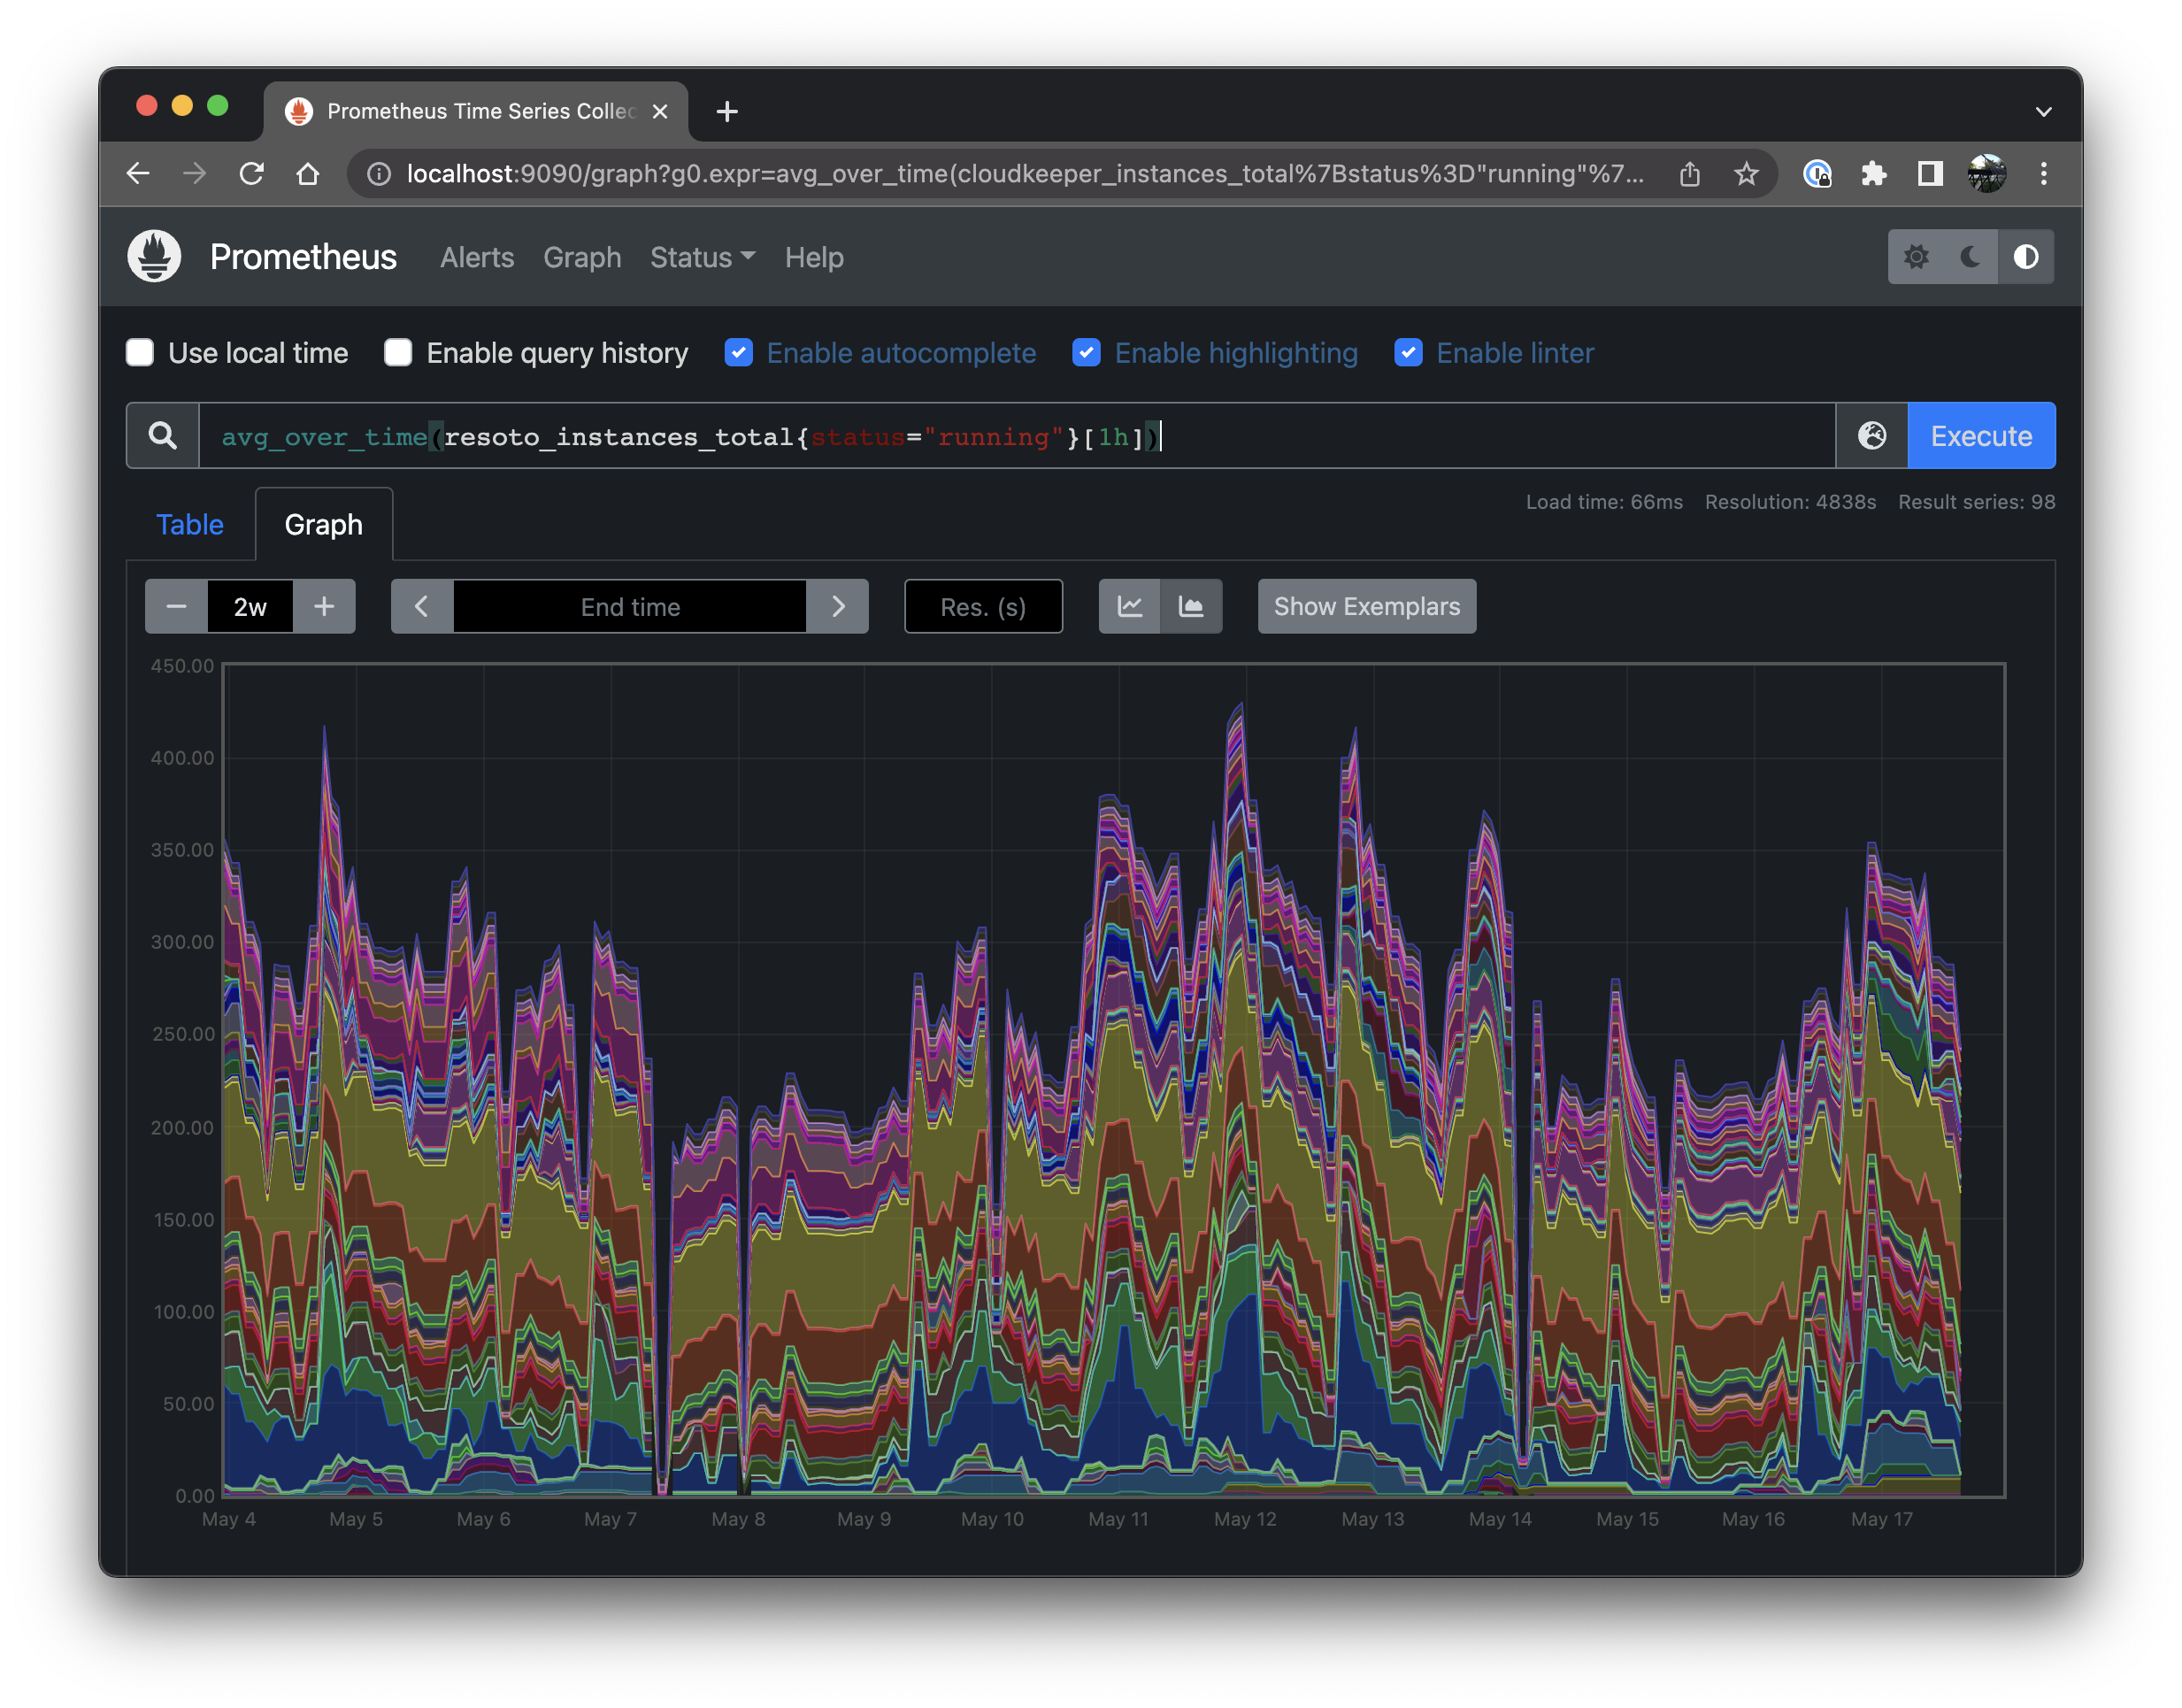
Click on the Graph tab, choose a 2w period and click the Show stacked graph button.
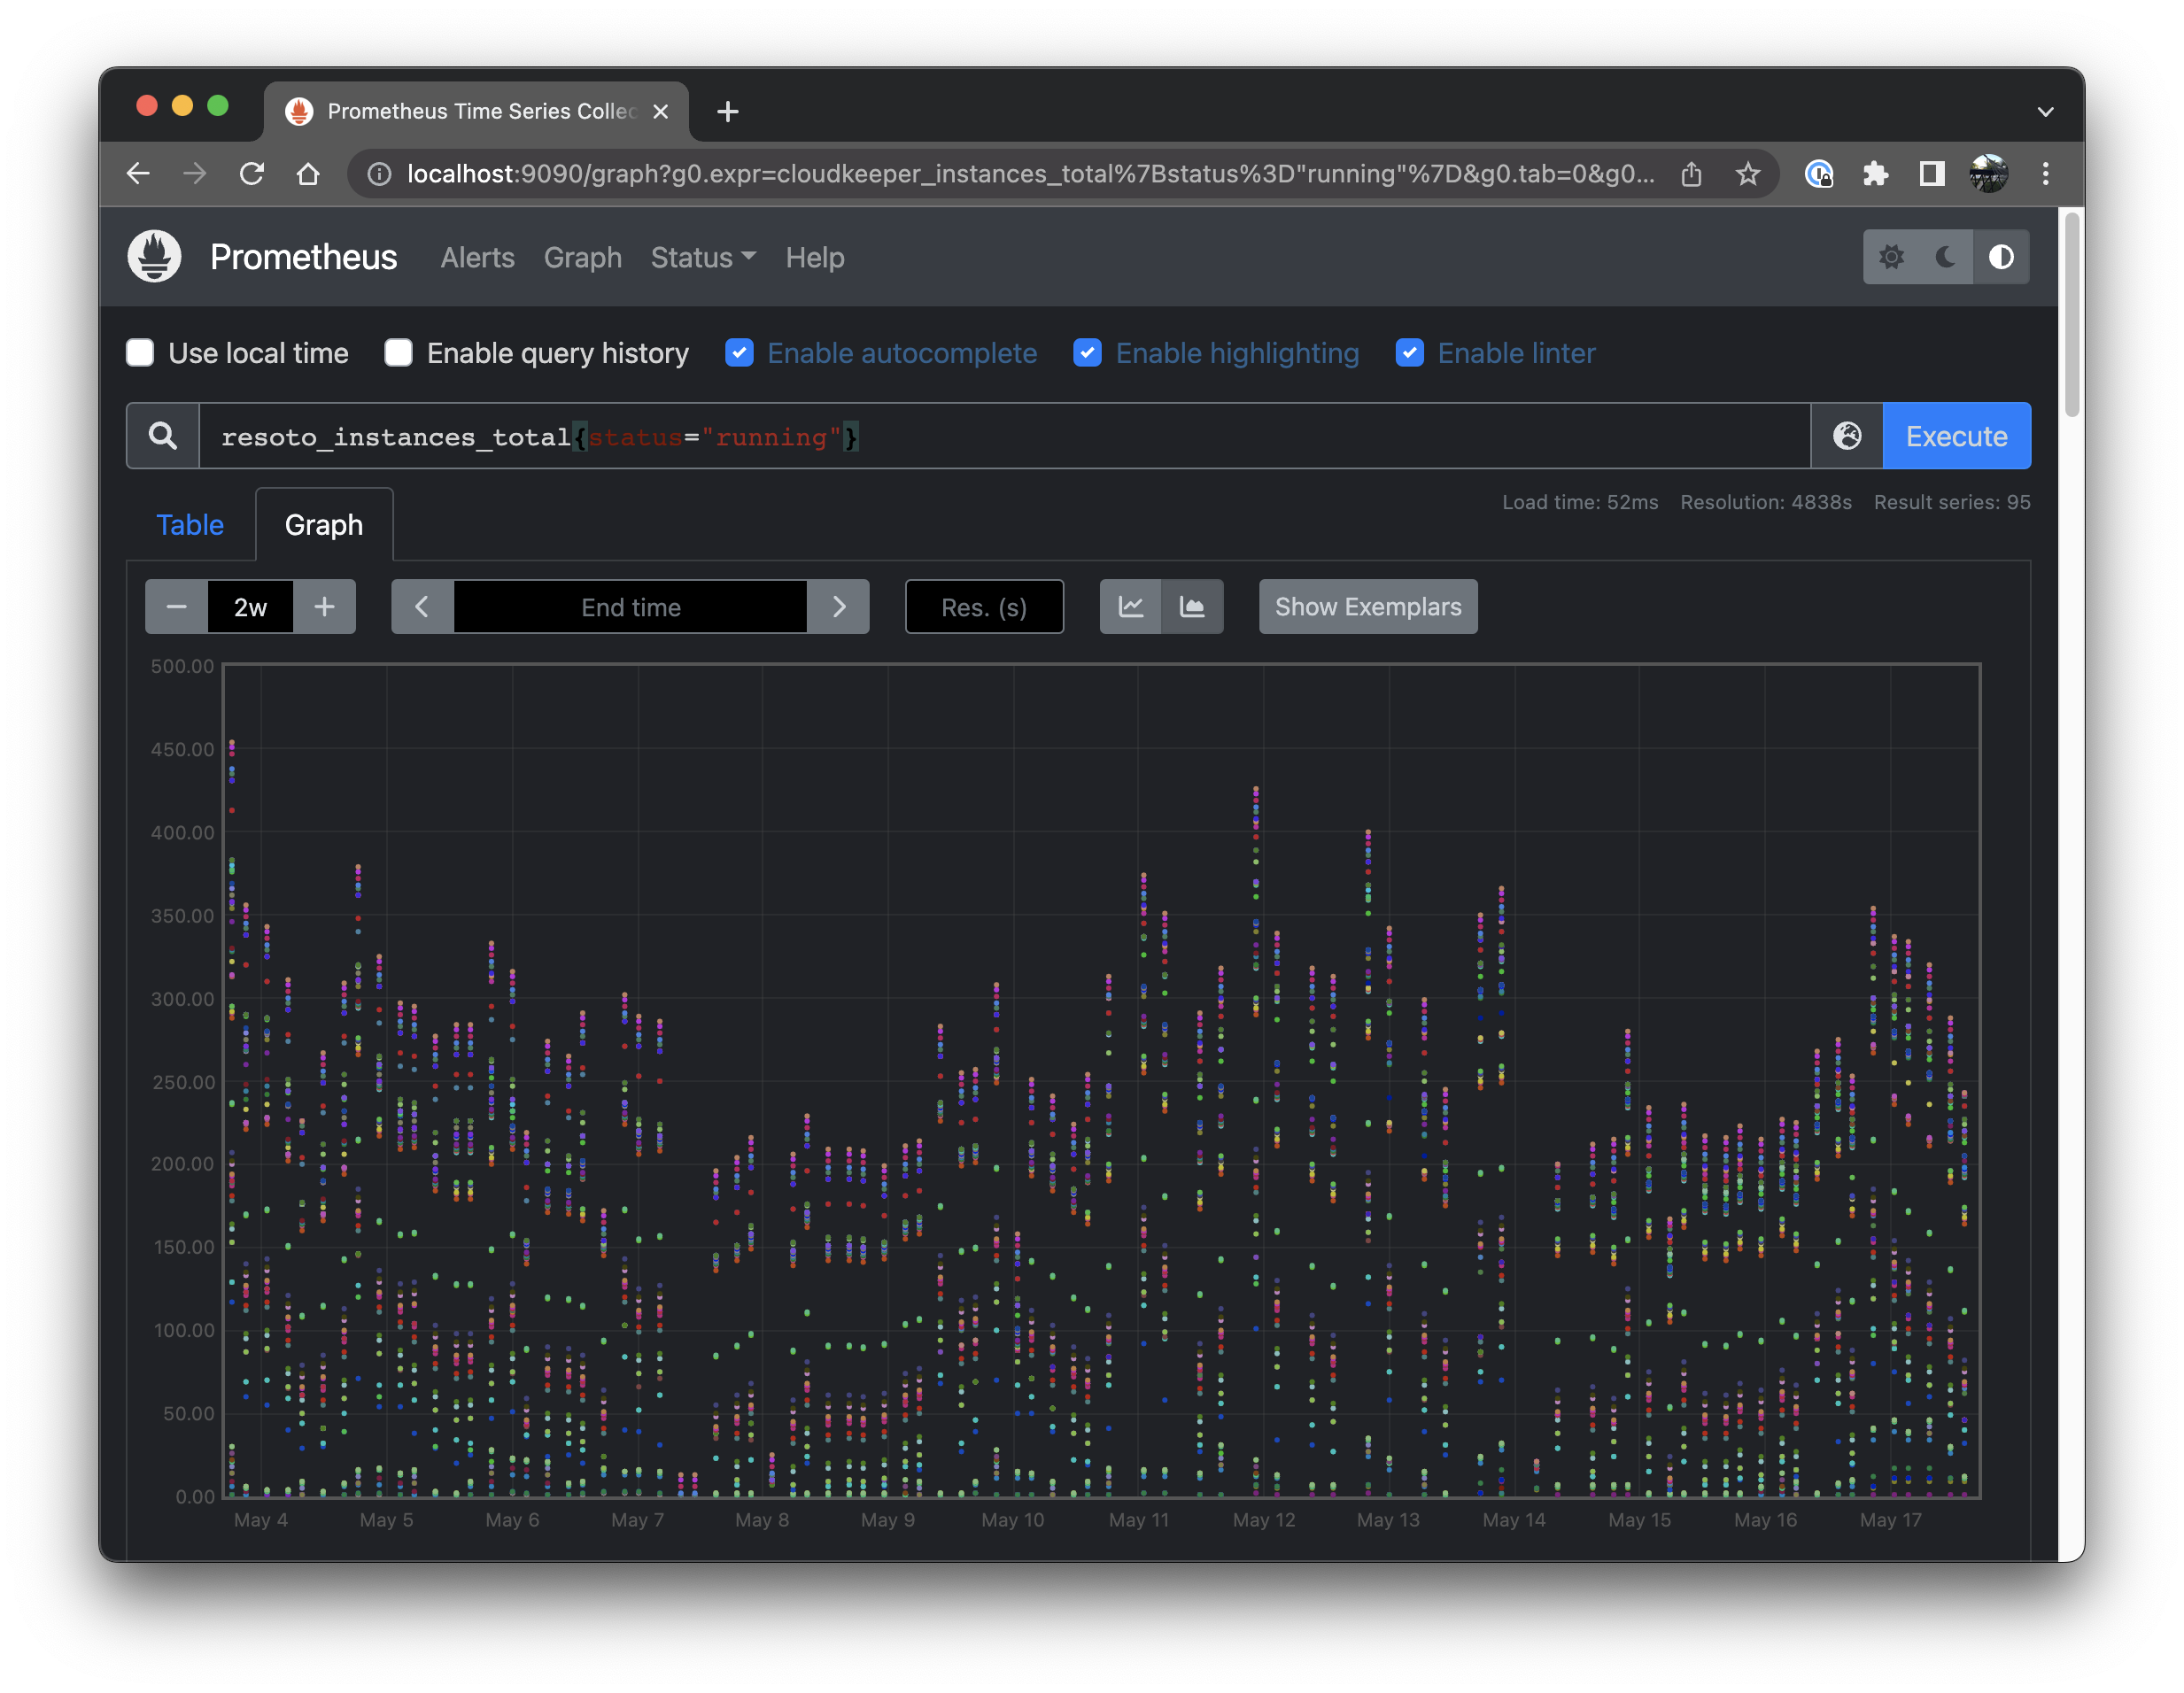
We are getting closer to what we'd like to see. But what are these speckles? Why aren't we seeing solid lines?
By default Resoto collects data once per hour. Let's tell Prometheus to create an average over time over one hour by changing the query to:
avg_over_time(resoto_instances_total{status="running"}[1h])
Good, the data points are connected and averaged over time. However the amount of labels is a bit overwhelming. Right now we are seeing one stacked chart per unique label combination. Let's try to reduce the amount of labels by summing them all up.
sum(avg_over_time(resoto_instances_total{status="running"}[1h]))
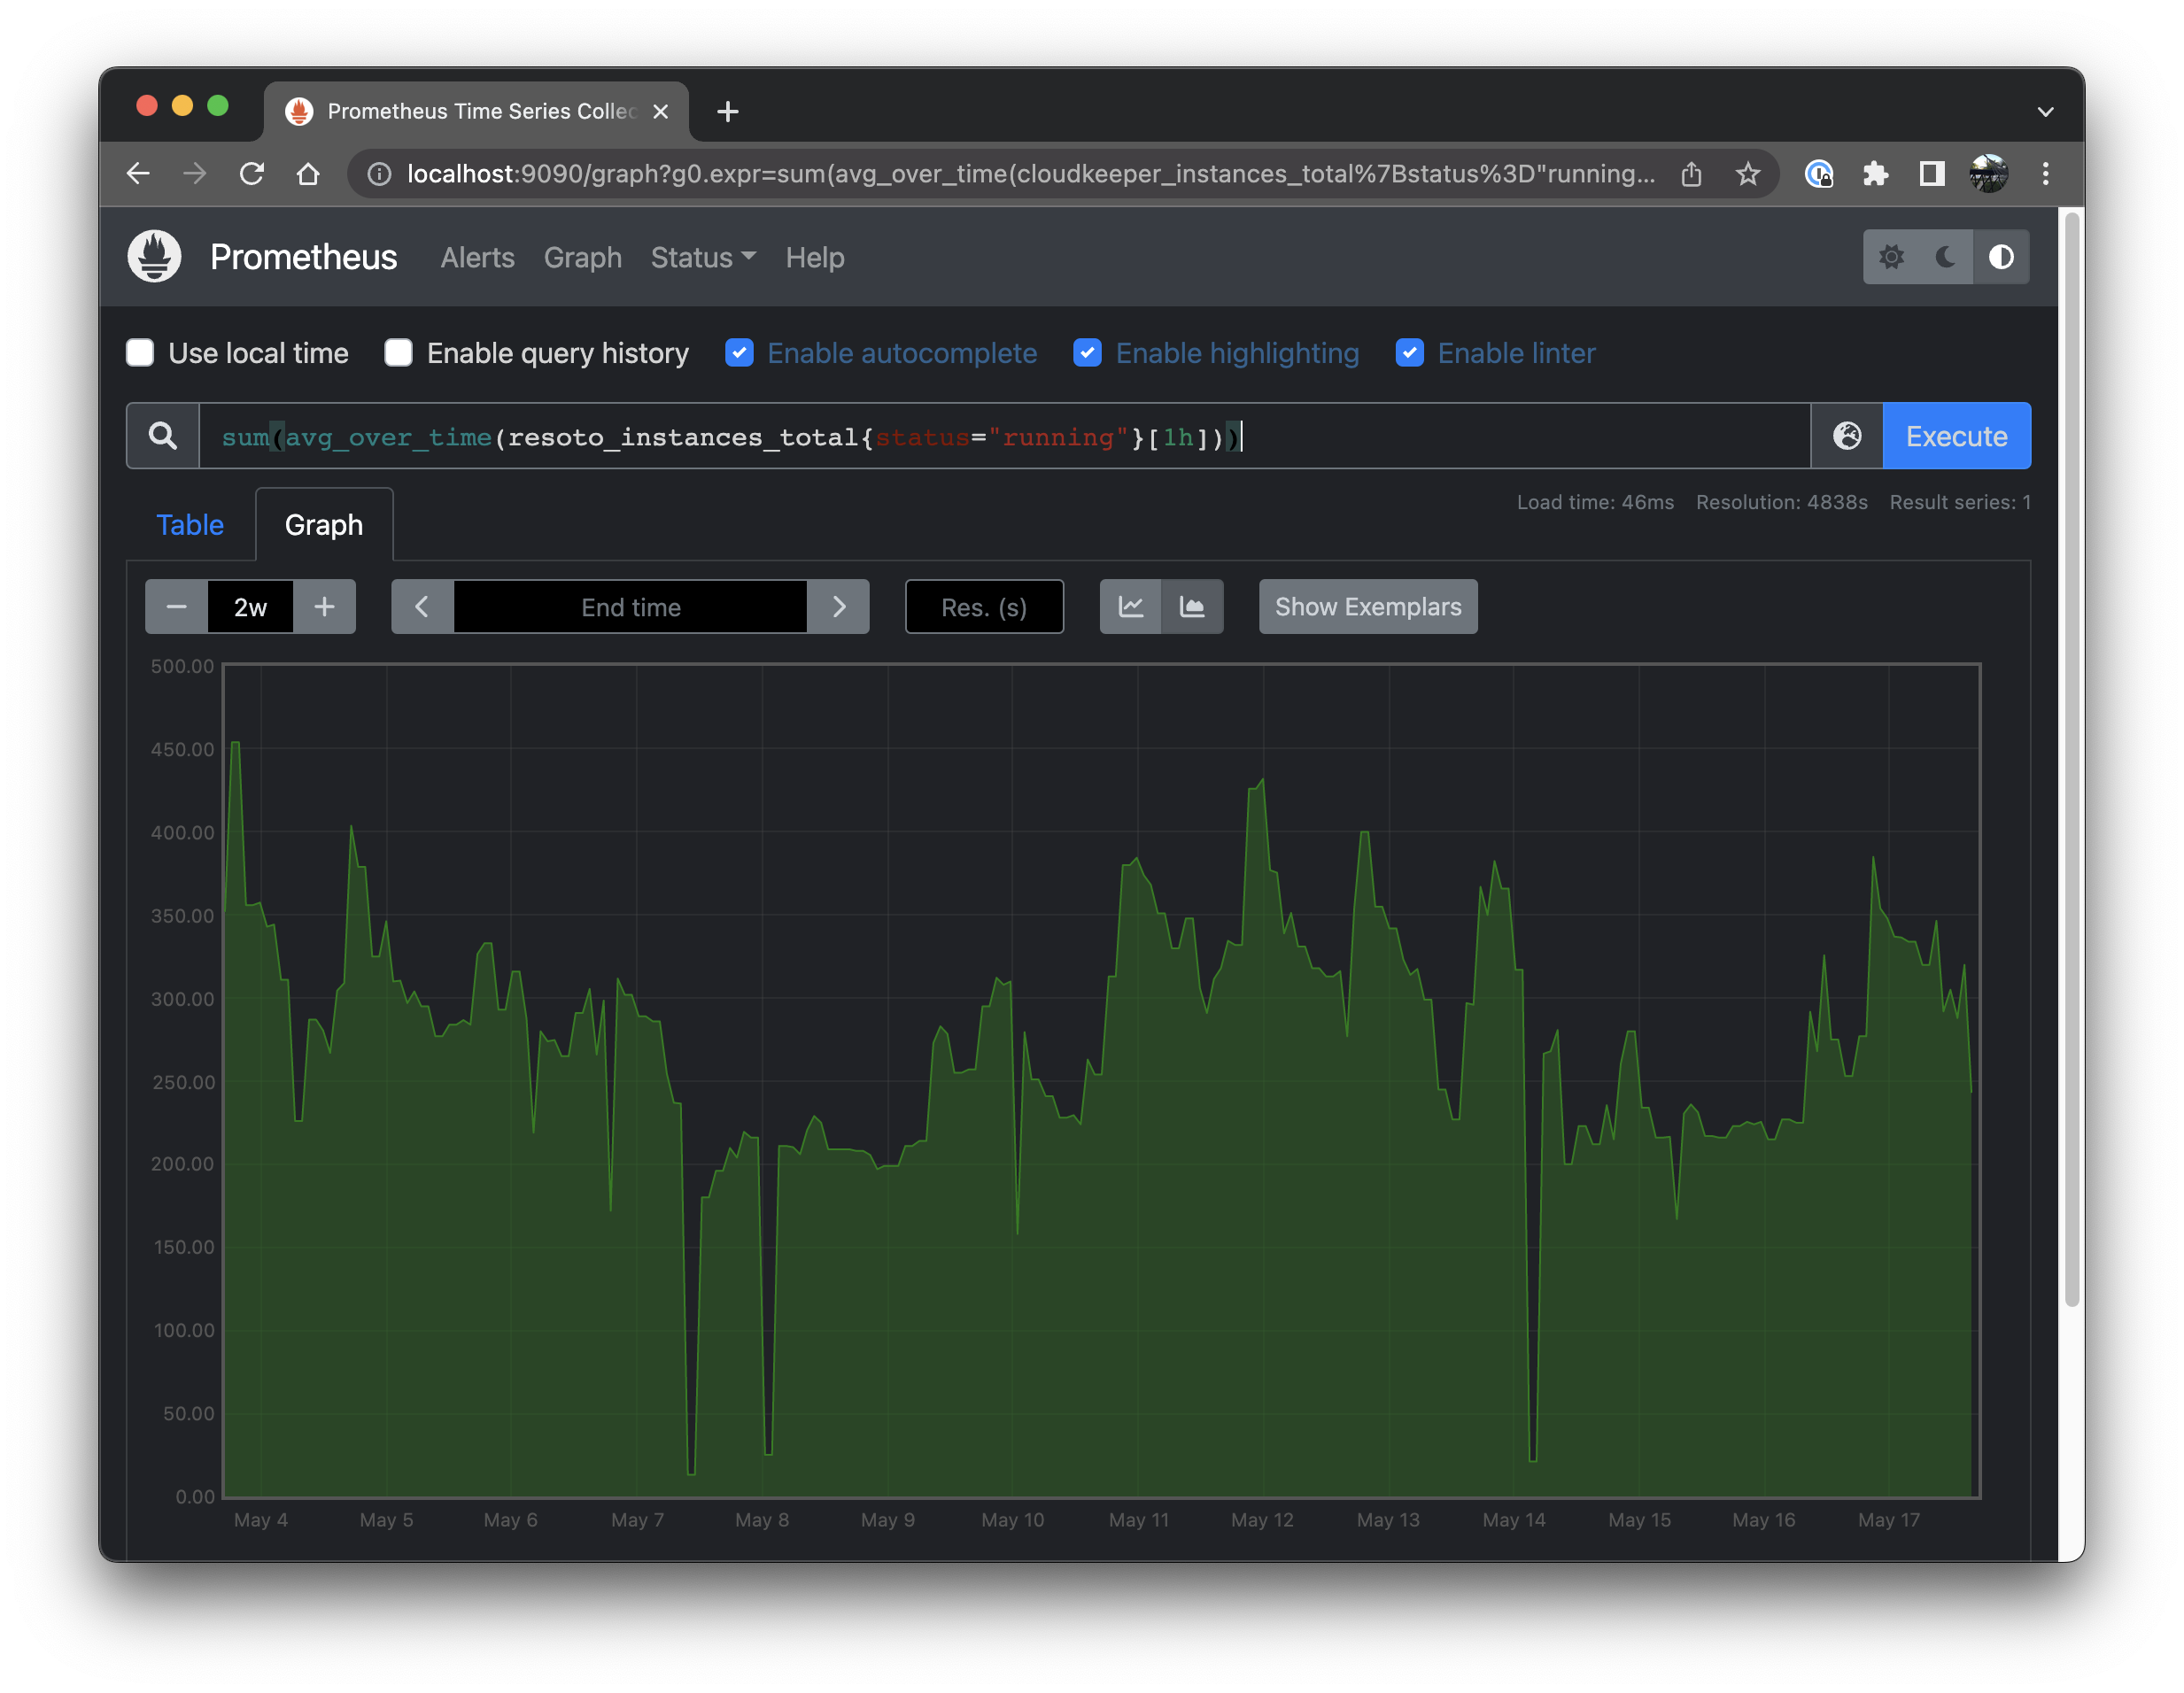
Nice, now we see how the total number of compute instances has changed over the last two weeks. However we lost absolutely all labels. No more accounts, region and instance type information. To get some information back, let's group the summed up averages by account.
sum(avg_over_time(resoto_instances_total{status="running"}[1h])) by (account)
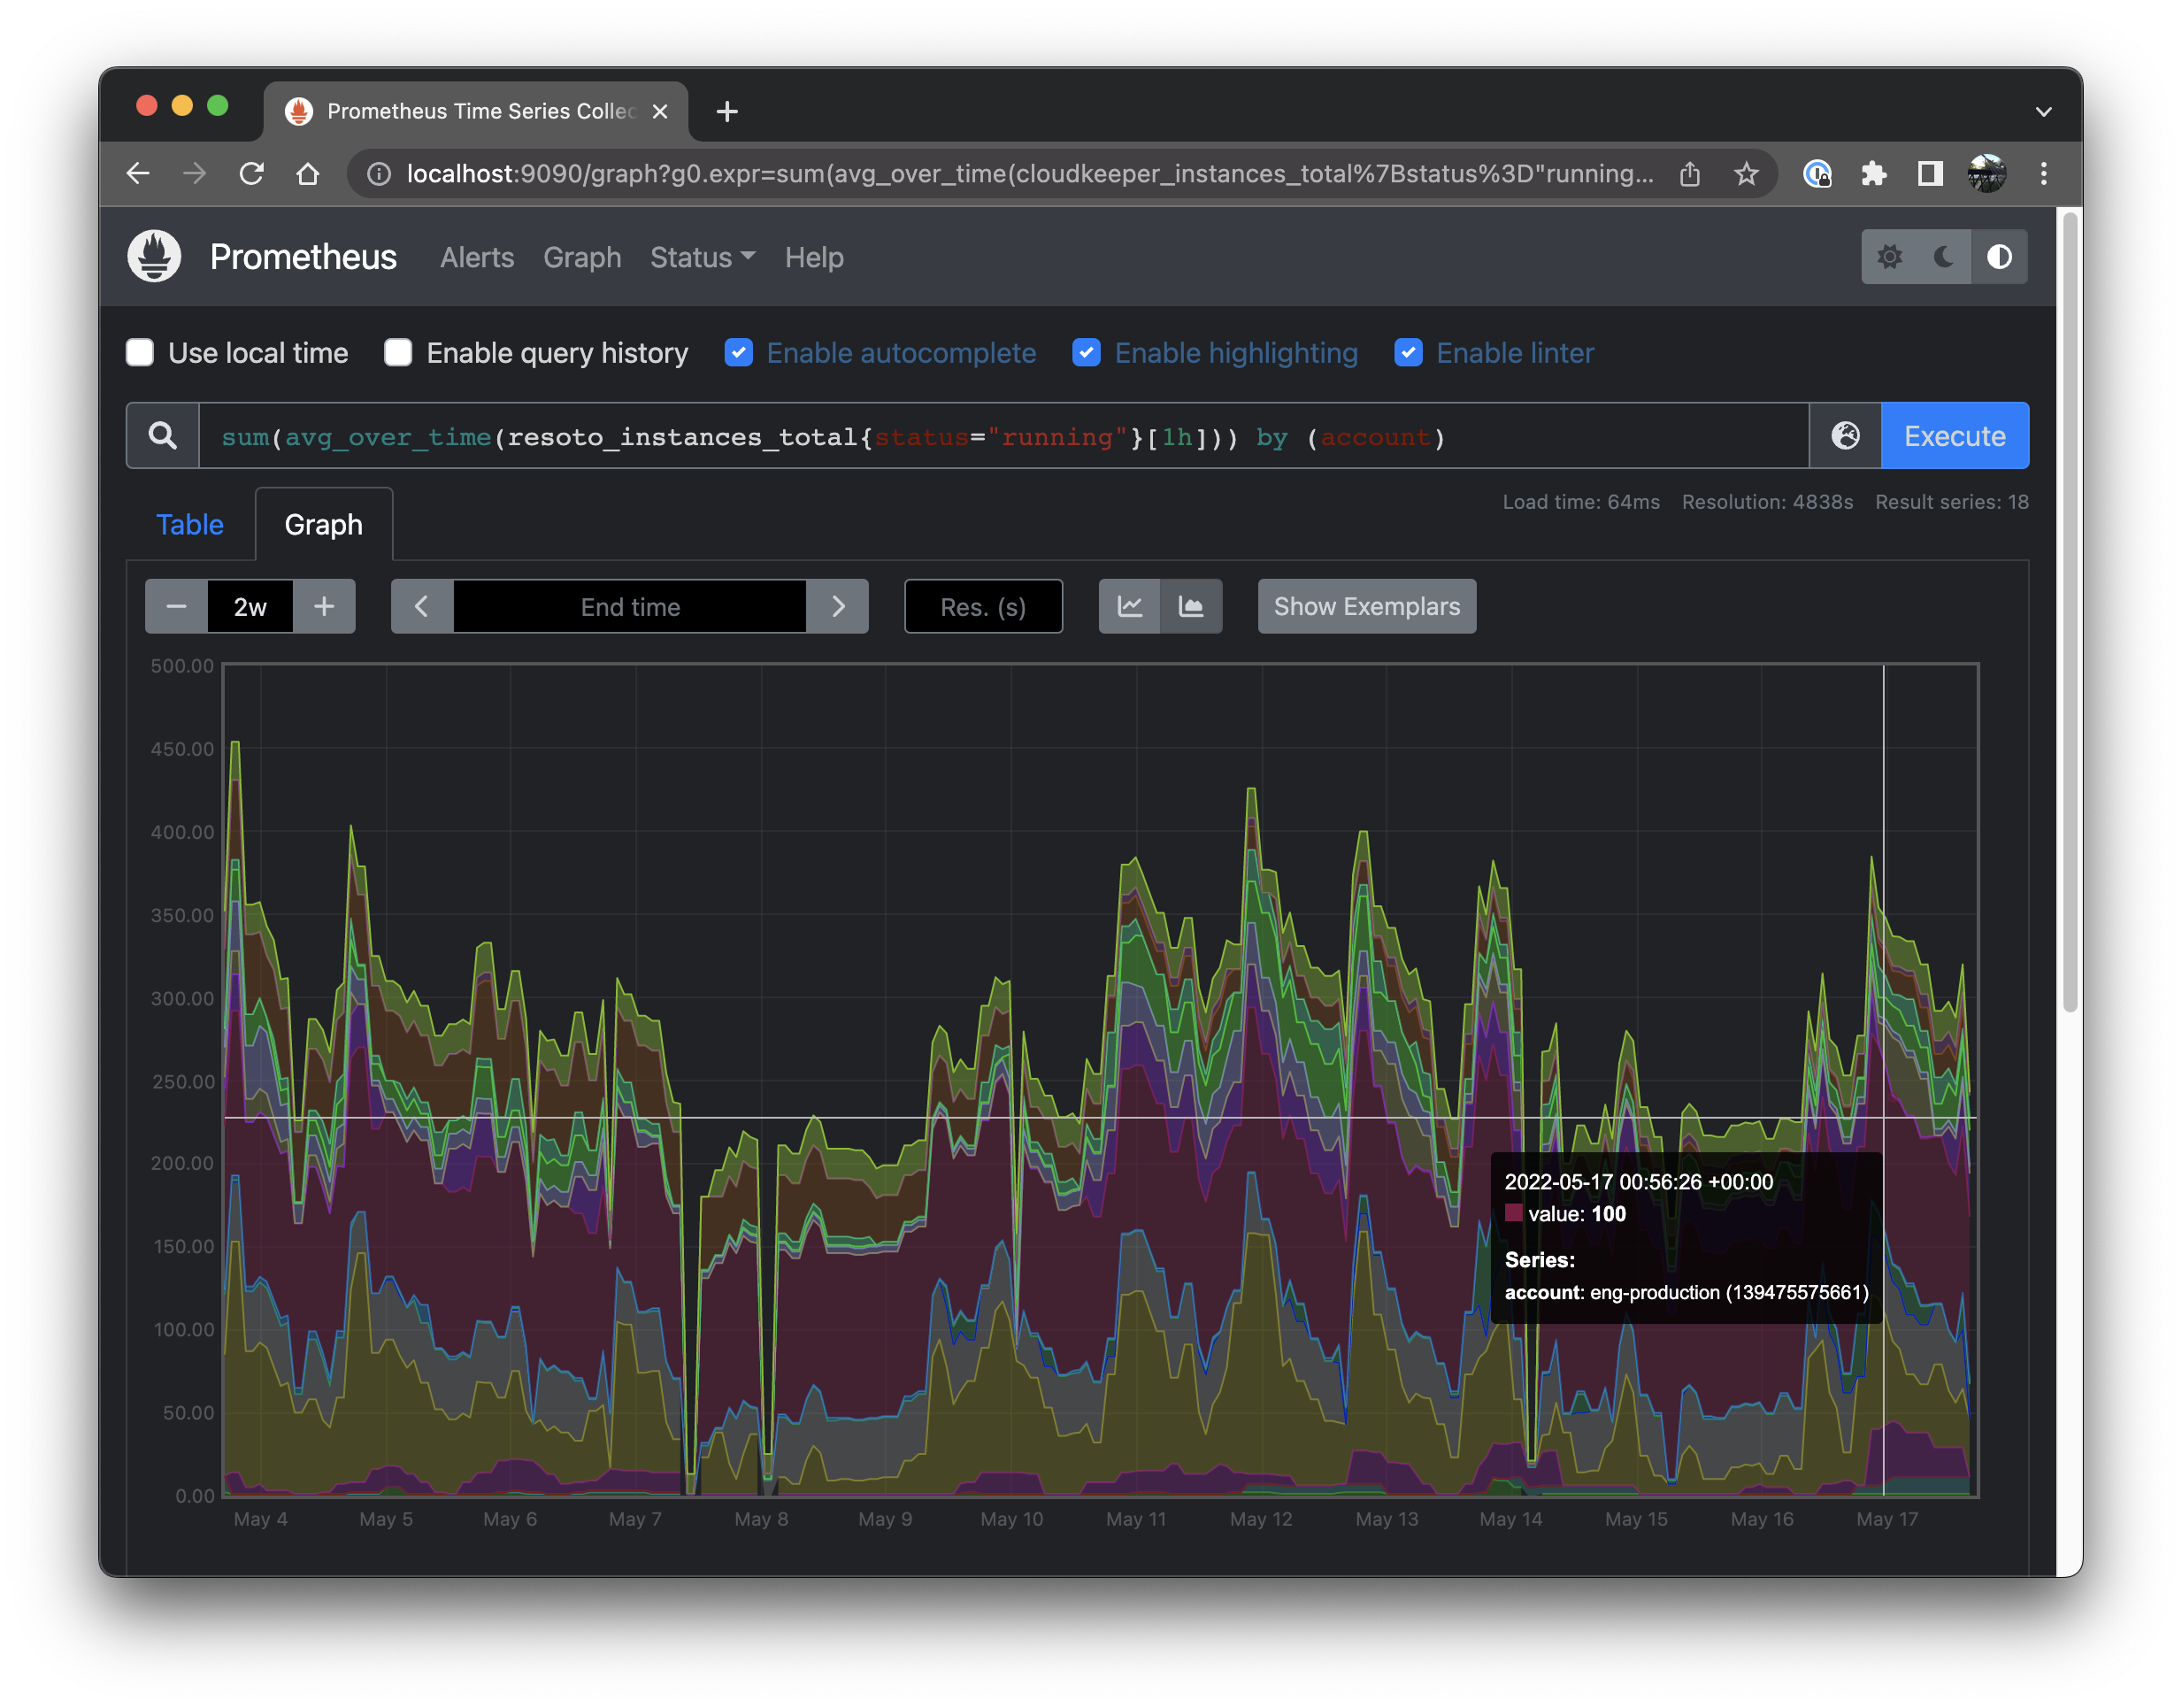
Neat, we see how the number of compute instances has changed over time for each account.
Want to see how storage has changed over time? Just change resoto_instances_total to resoto_volume_bytes. Want to see $$$ spent per hour? resoto_instances_hourly_cost_estimate is the metric you are looking for.
How Metrics Are Made
The Prometheus web UI provides syntax help and autocomplete for available metric names. However, you may be wondering—how are you supposed to know which metrics exist? How do you find what other metrics exist and where a value (for example, resoto_instances_total) is defined?
Metrics are defined in the resoto.metrics configuration. To edit metrics definitions, execute the following command in Resoto Shell:
> config edit resoto.metrics
resotometrics:
  metrics:
    instances_total:
      # Metric help text
      help: 'Number of Instances'
      # Aggregation search to run
      search: 'aggregate(/ancestors.cloud.reported.name as cloud, /ancestors.account.reported.name as account, /ancestors.region.reported.name as region, instance_type as type, instance_status as status: sum(1) as instances_total): is(instance)'
      # Type of metric (gauge or counter)
      type: 'gauge'
    ...
  ...
As described above, the aggregate expression in the search field is what creates the samples of a metric.
Metrics configuration can be updated at runtime. When the metrics workflow is run, Resoto Metrics will generate the new metric for Prometheus to consume.
> workflow run metrics
Creating a Metrics Dashboard
Now that we've learned how to get metrics from Resoto into Prometheus, query metrics, and define new metrics, we can create the dashboard.
Alright, fasten your seatbelts! This will go fast. 🏎️💨
-
Start the Grafana Docker container:
$ docker run -d -p 3000:3000 -v grafana-data:/var/lib/grafana -v grafana-etc:/etc/grafana grafana/grafana-oss -
Open the Grafana web UI (e.g., http://localhost:3000).
-
Login as
adminwith passwordadminand set a new password. -
On the left, open Settings > Data Sources > Add Data Source > Prometheus.
-
In the URL field, enter the Prometheus URL e.g.
http://tsdb.docker.internal:9090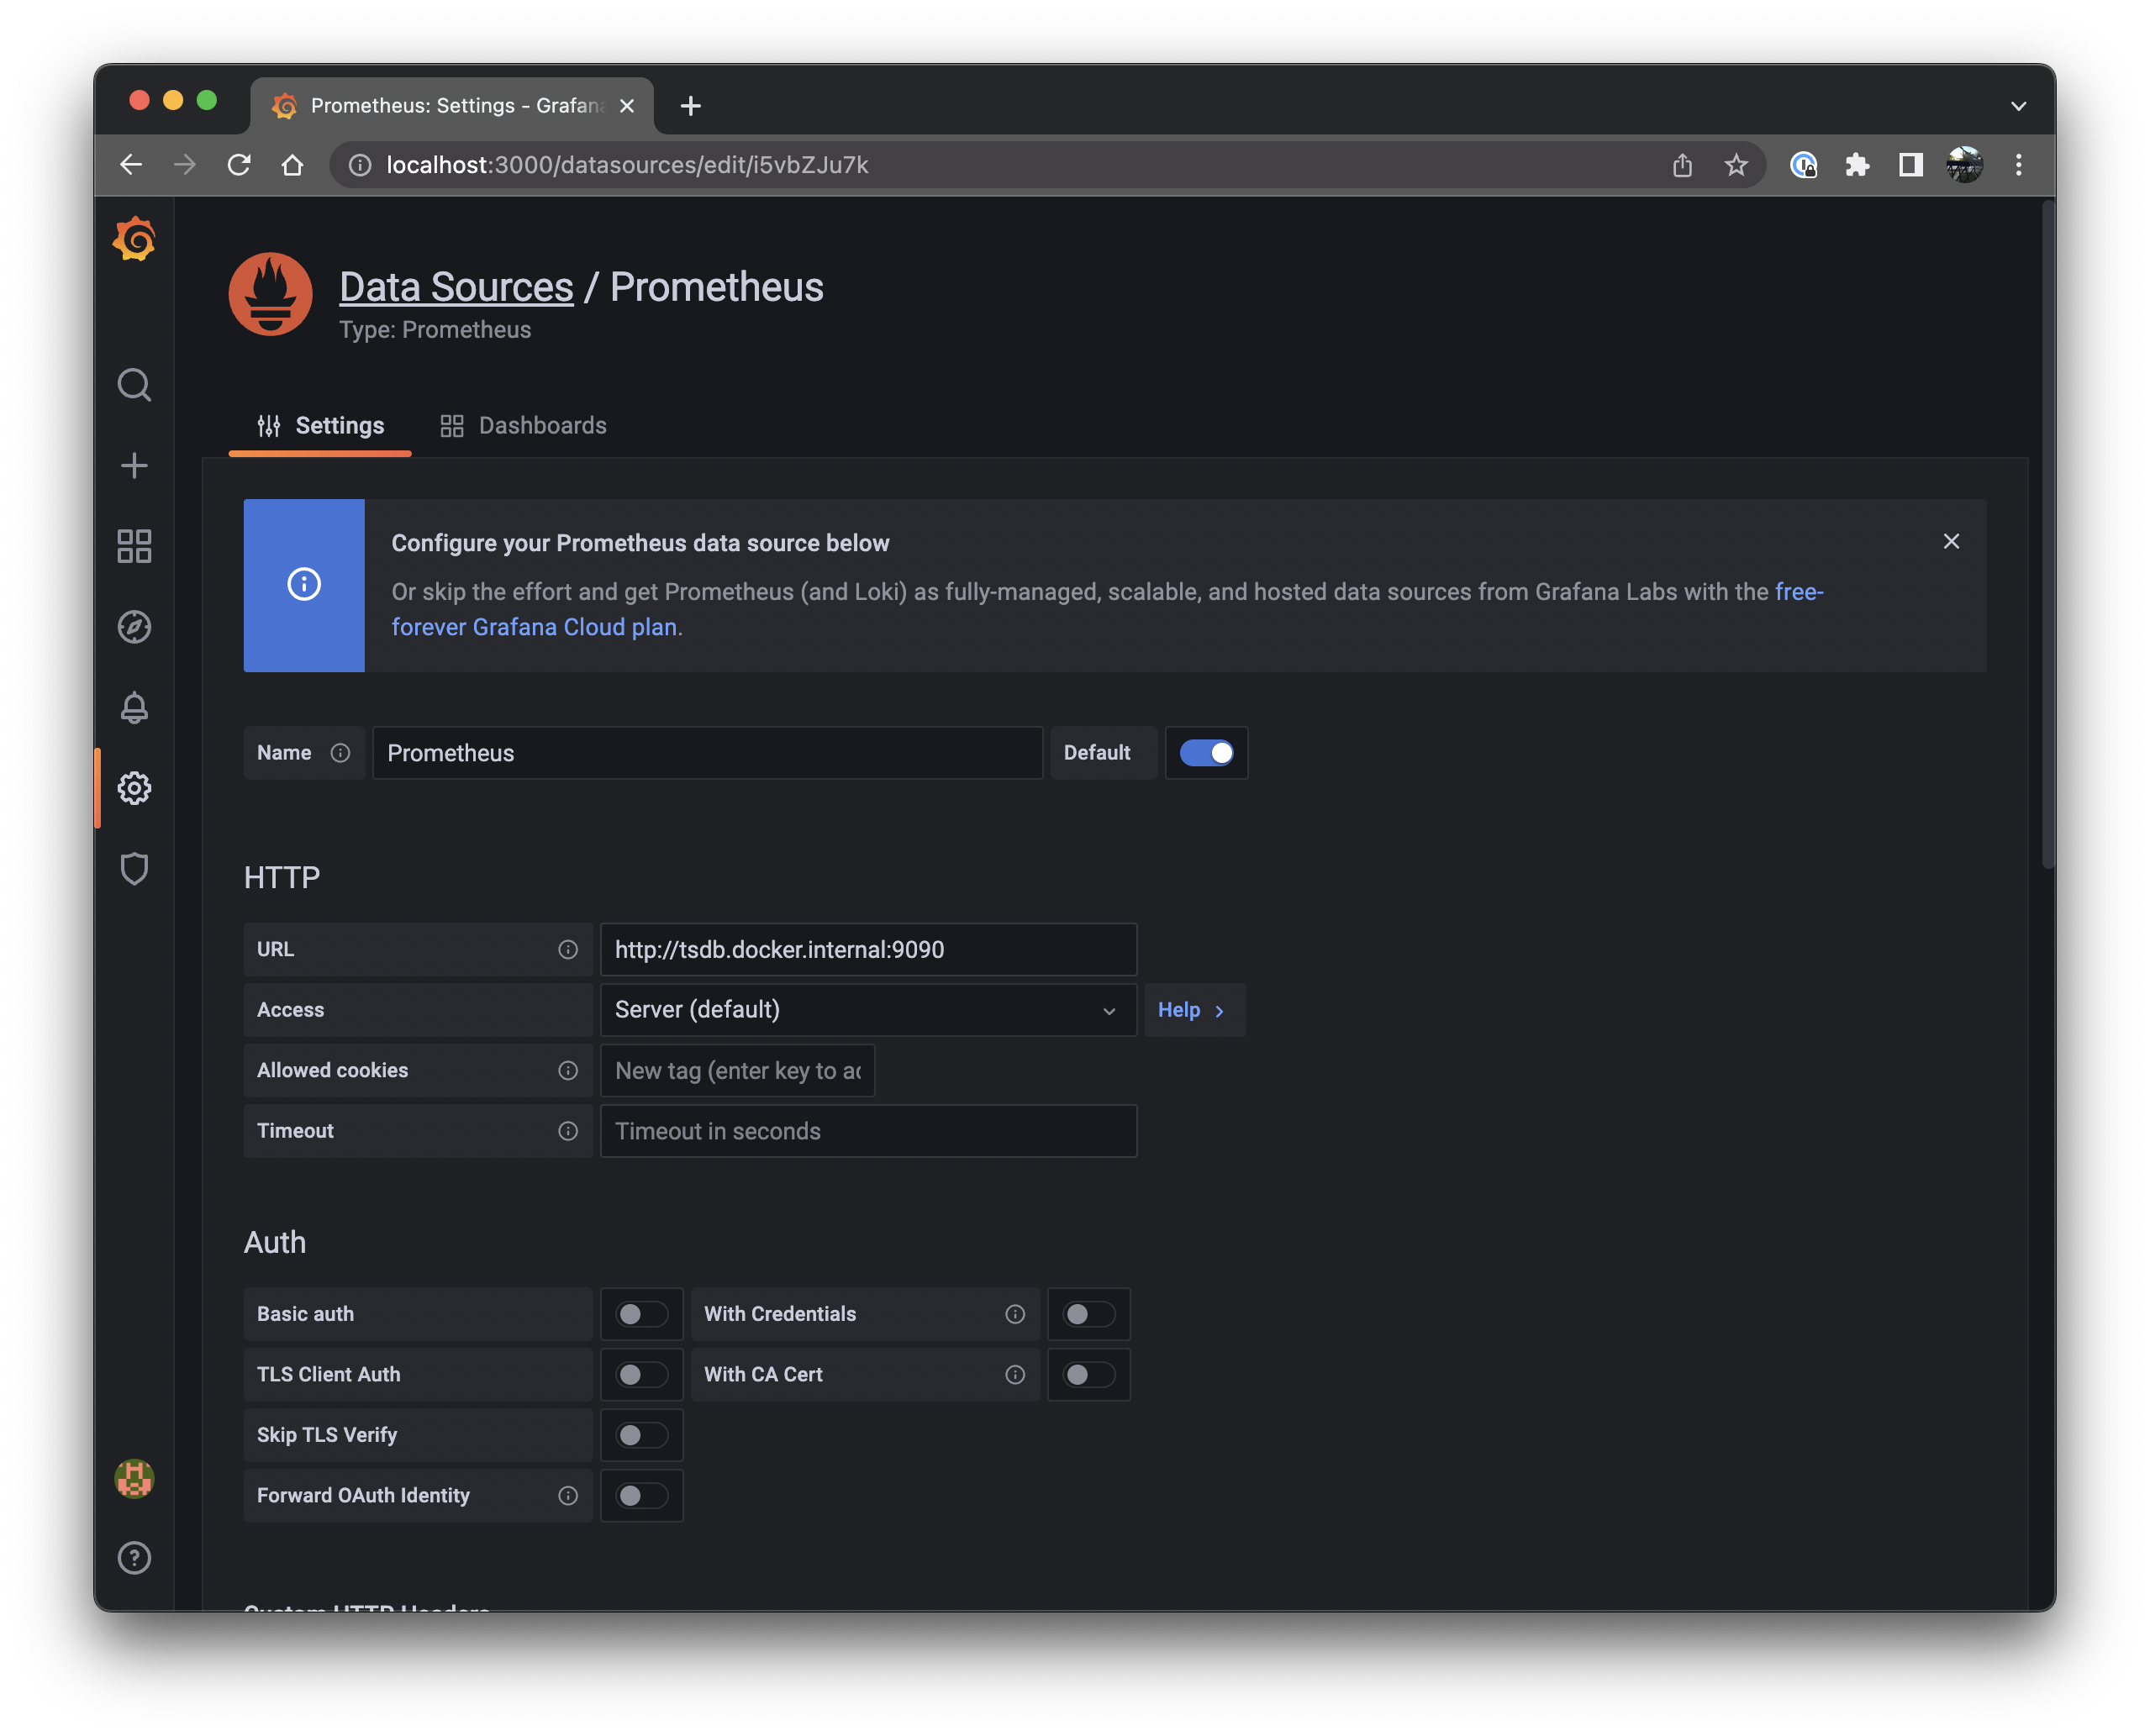
-
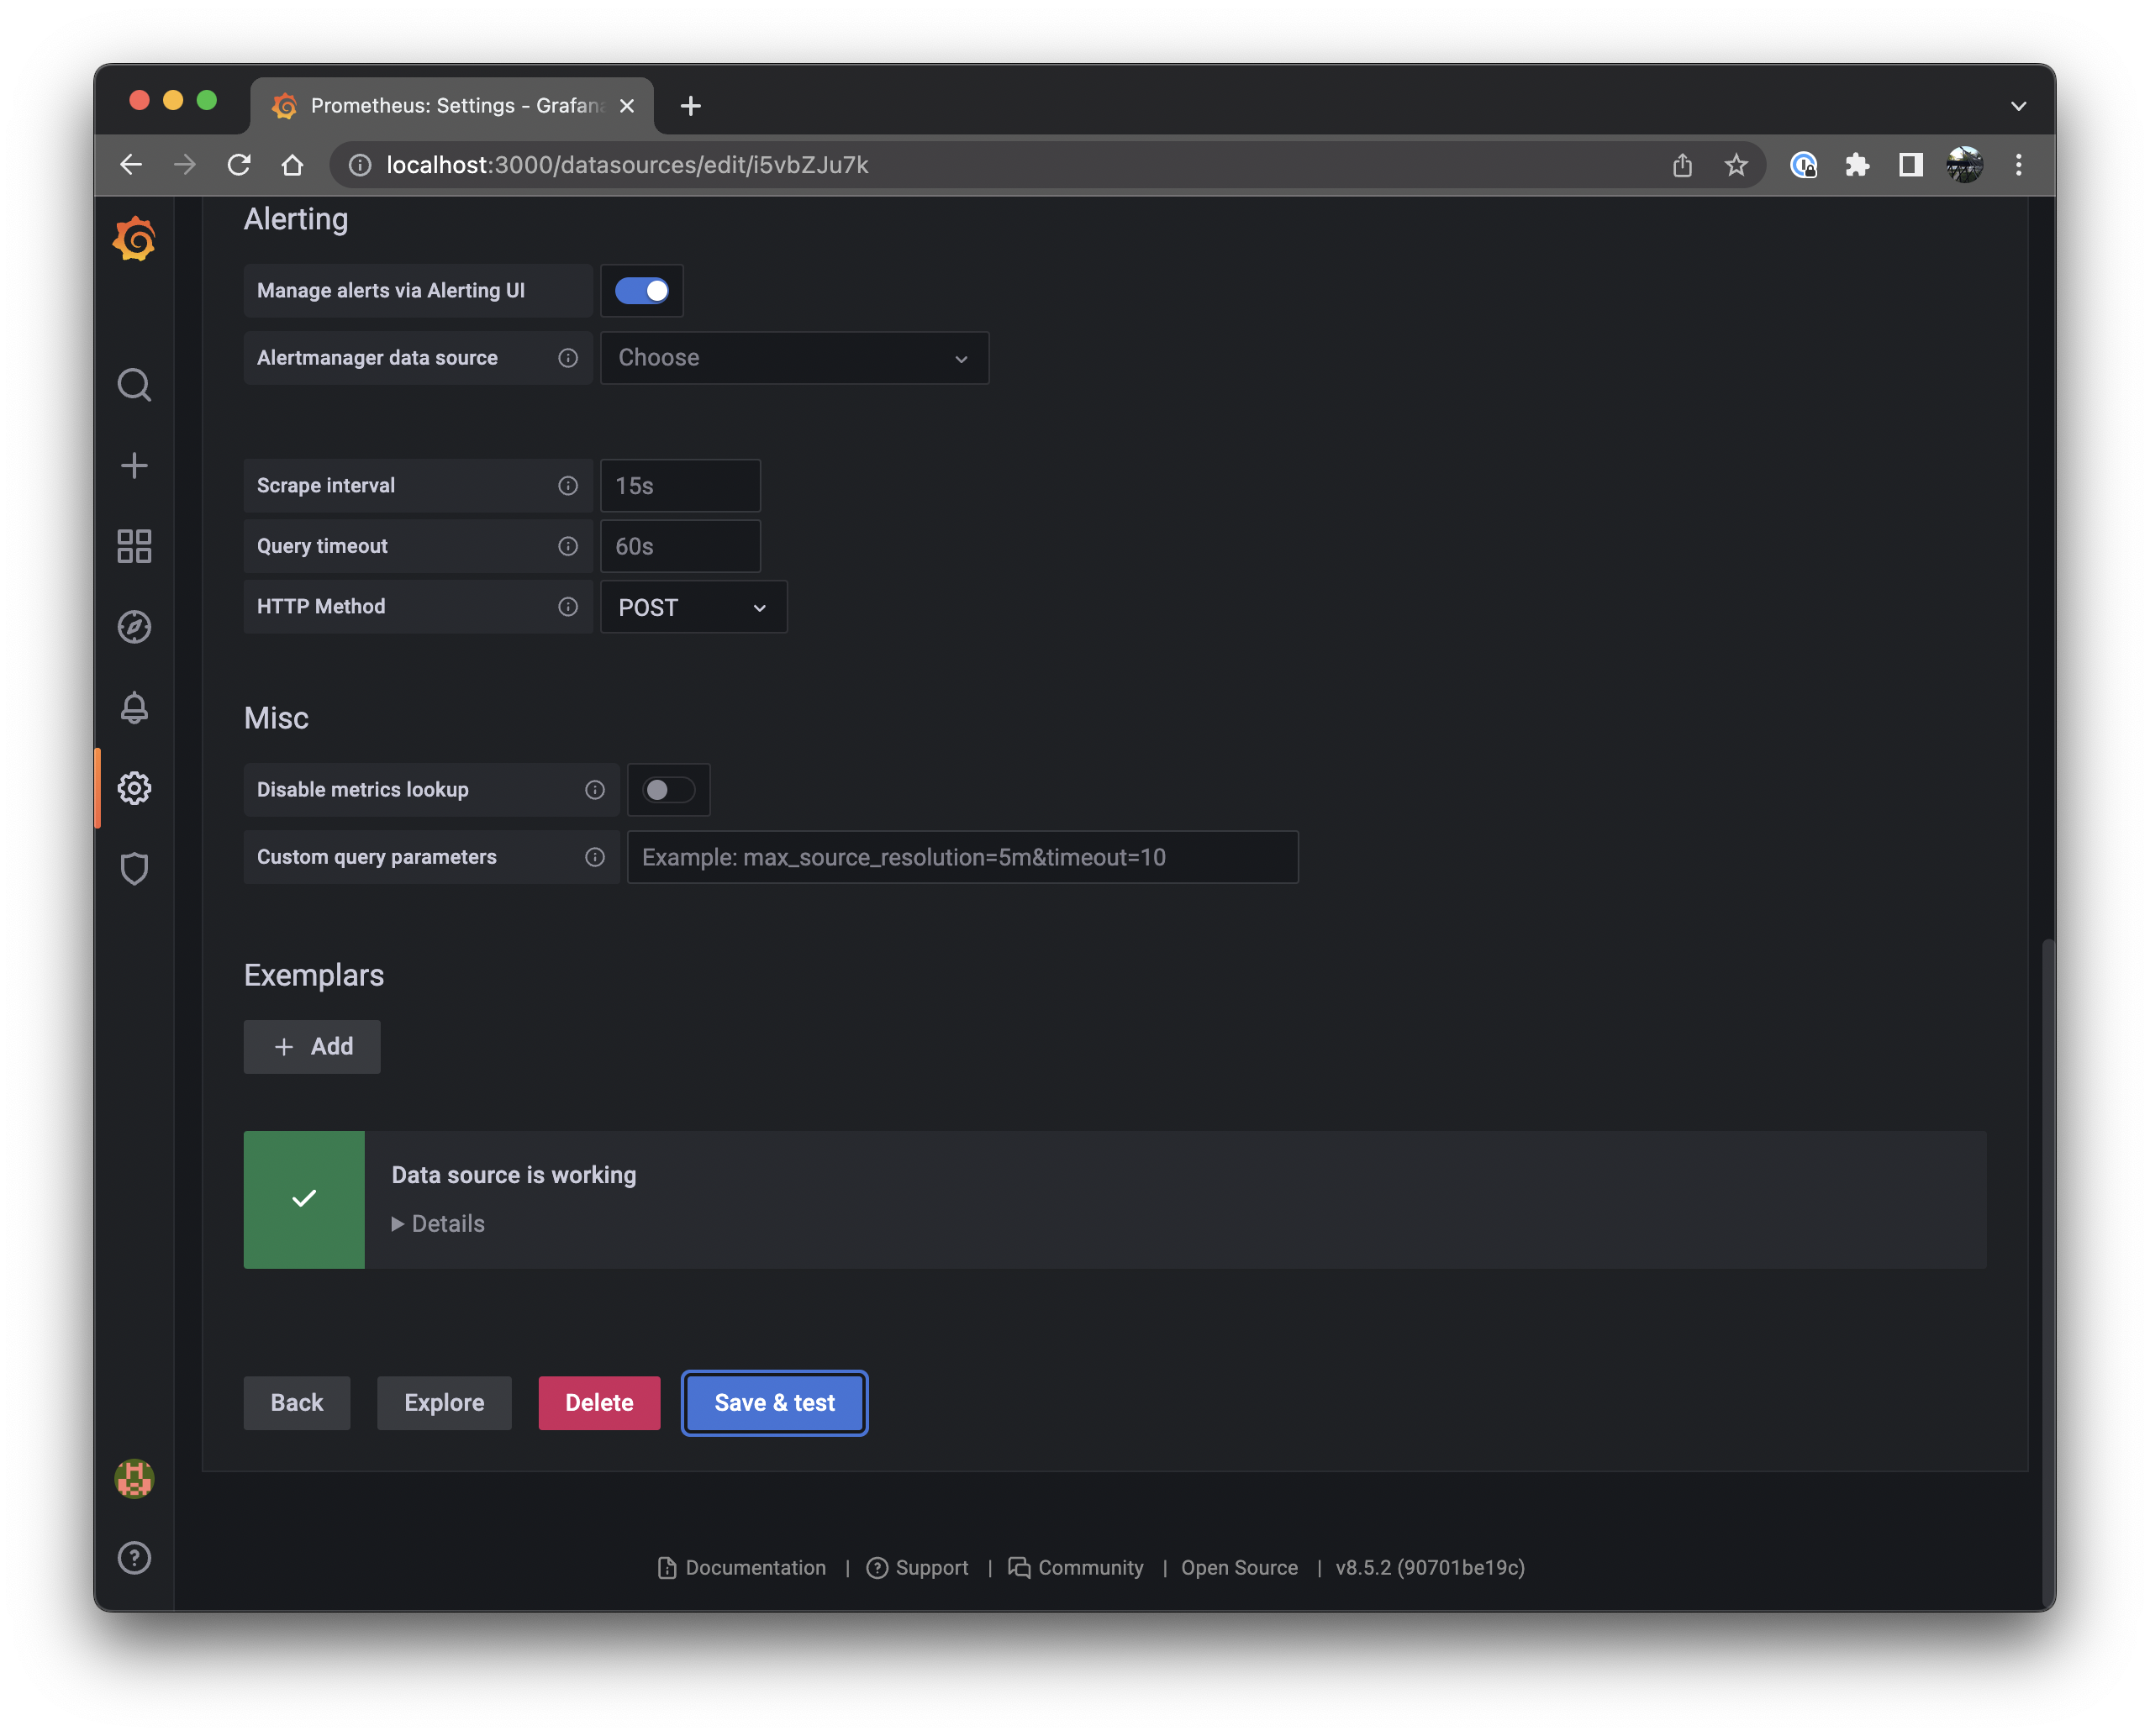
Scroll down and click the Save & test button. Make sure that the result is "Data source is working":
-
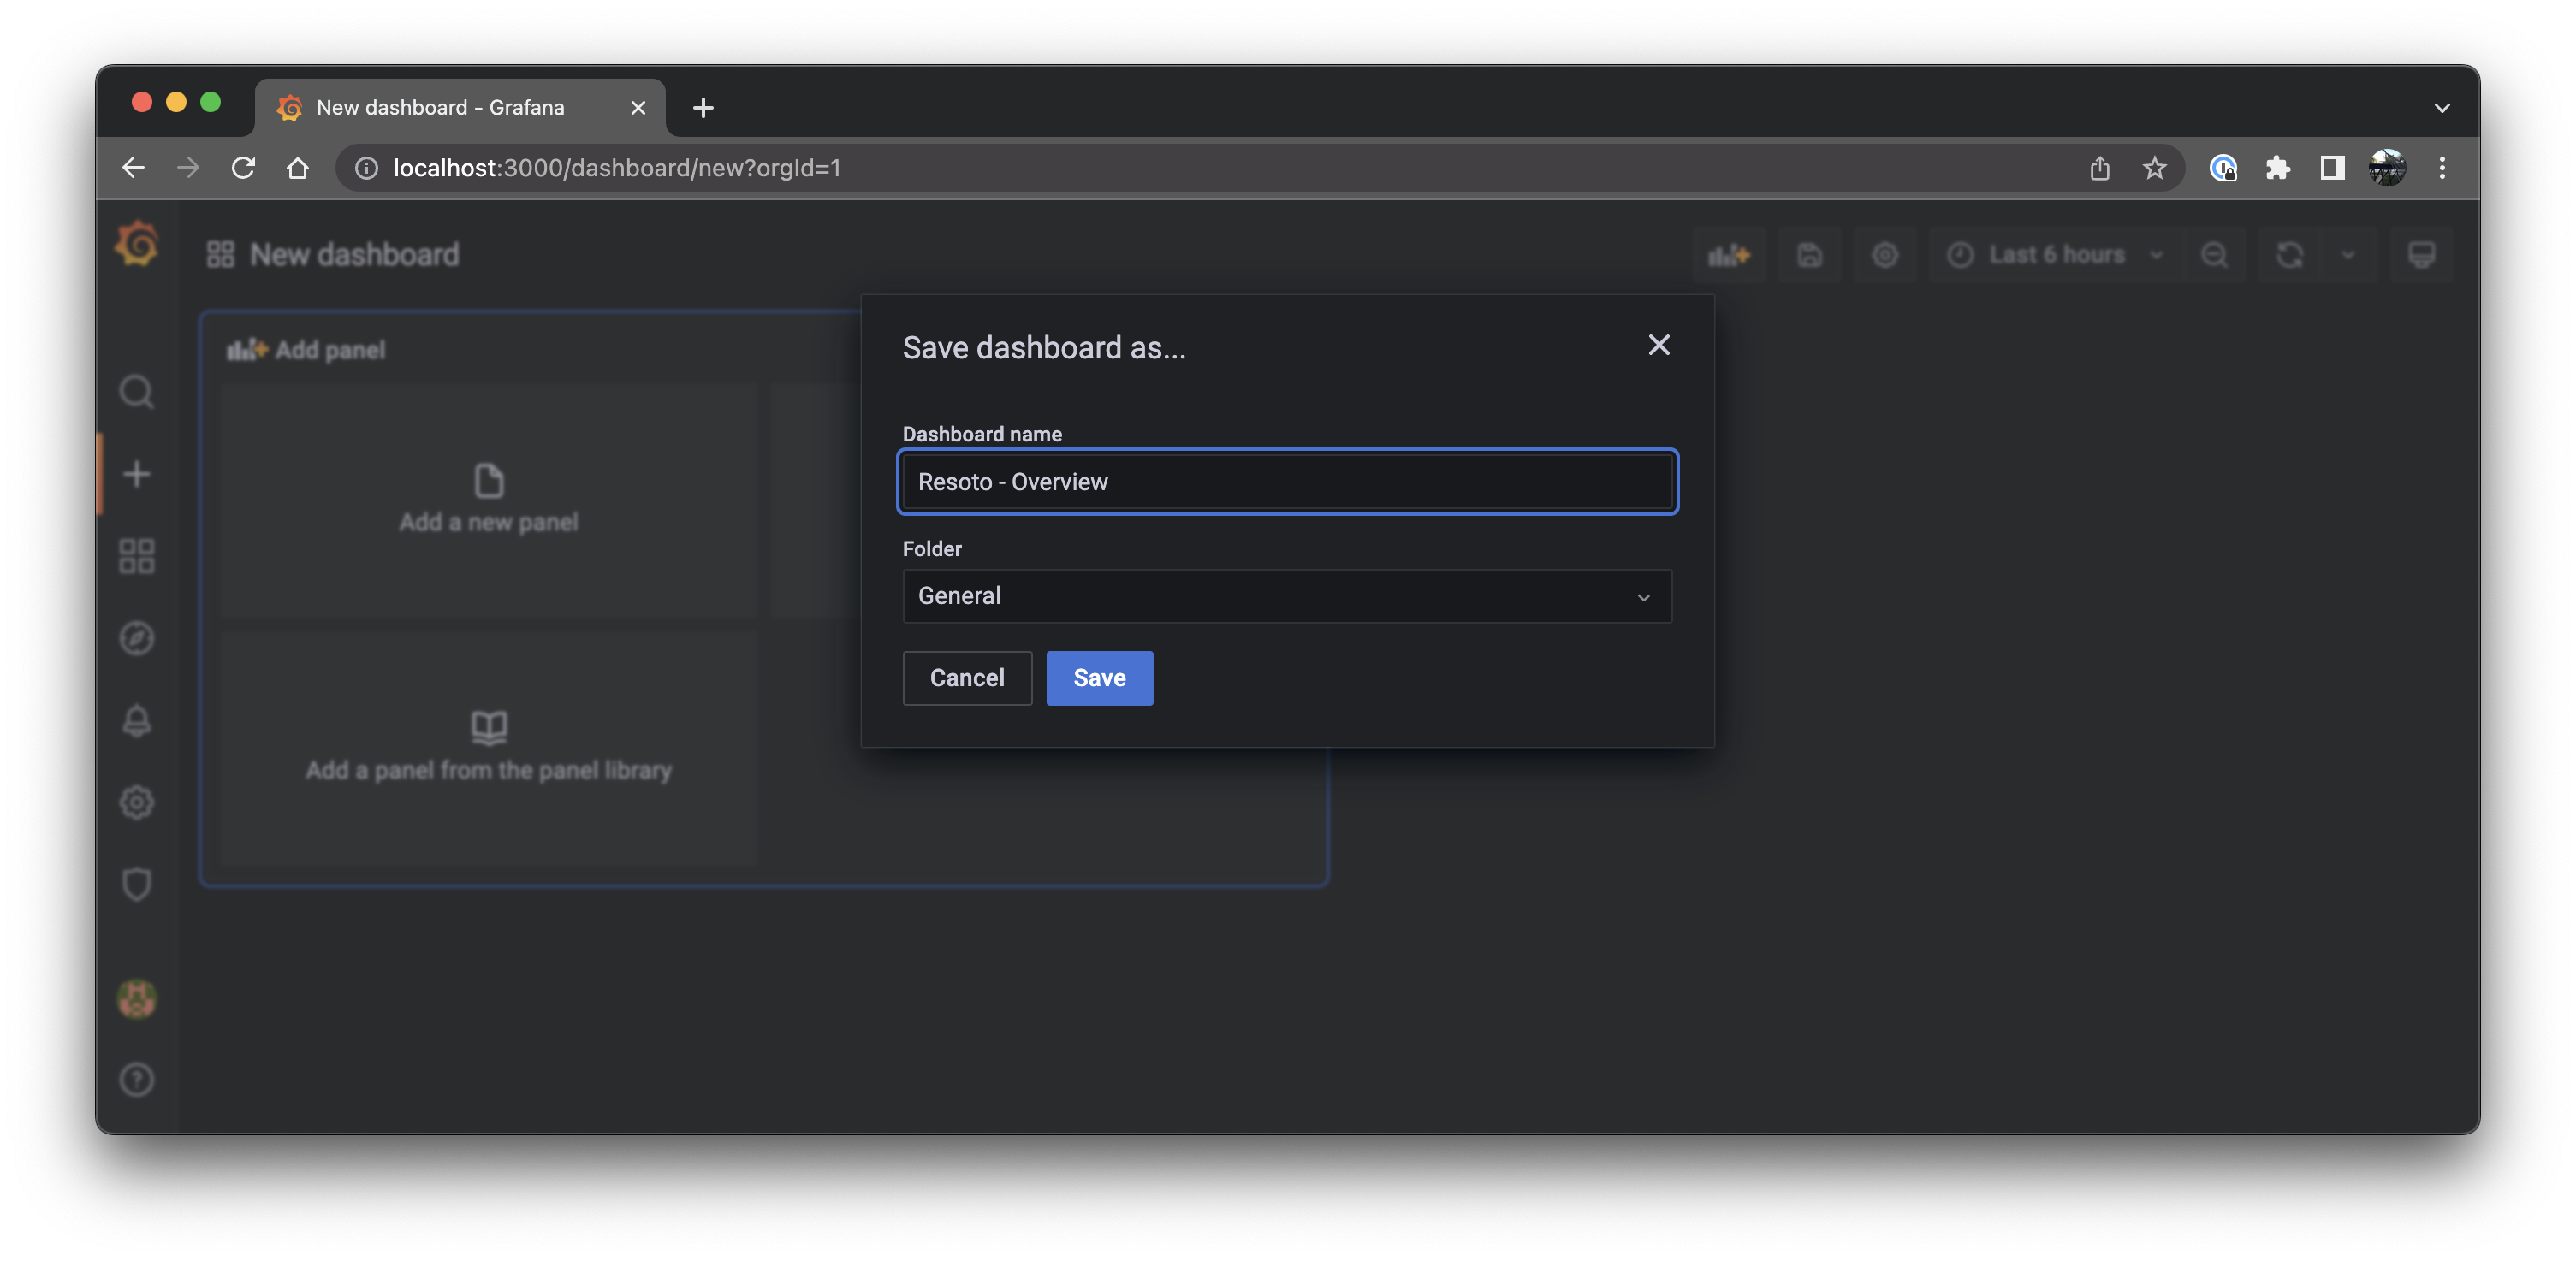
Click the + button on the left, select Create Dashboard, and then click the Save button in the top menu bar.
-
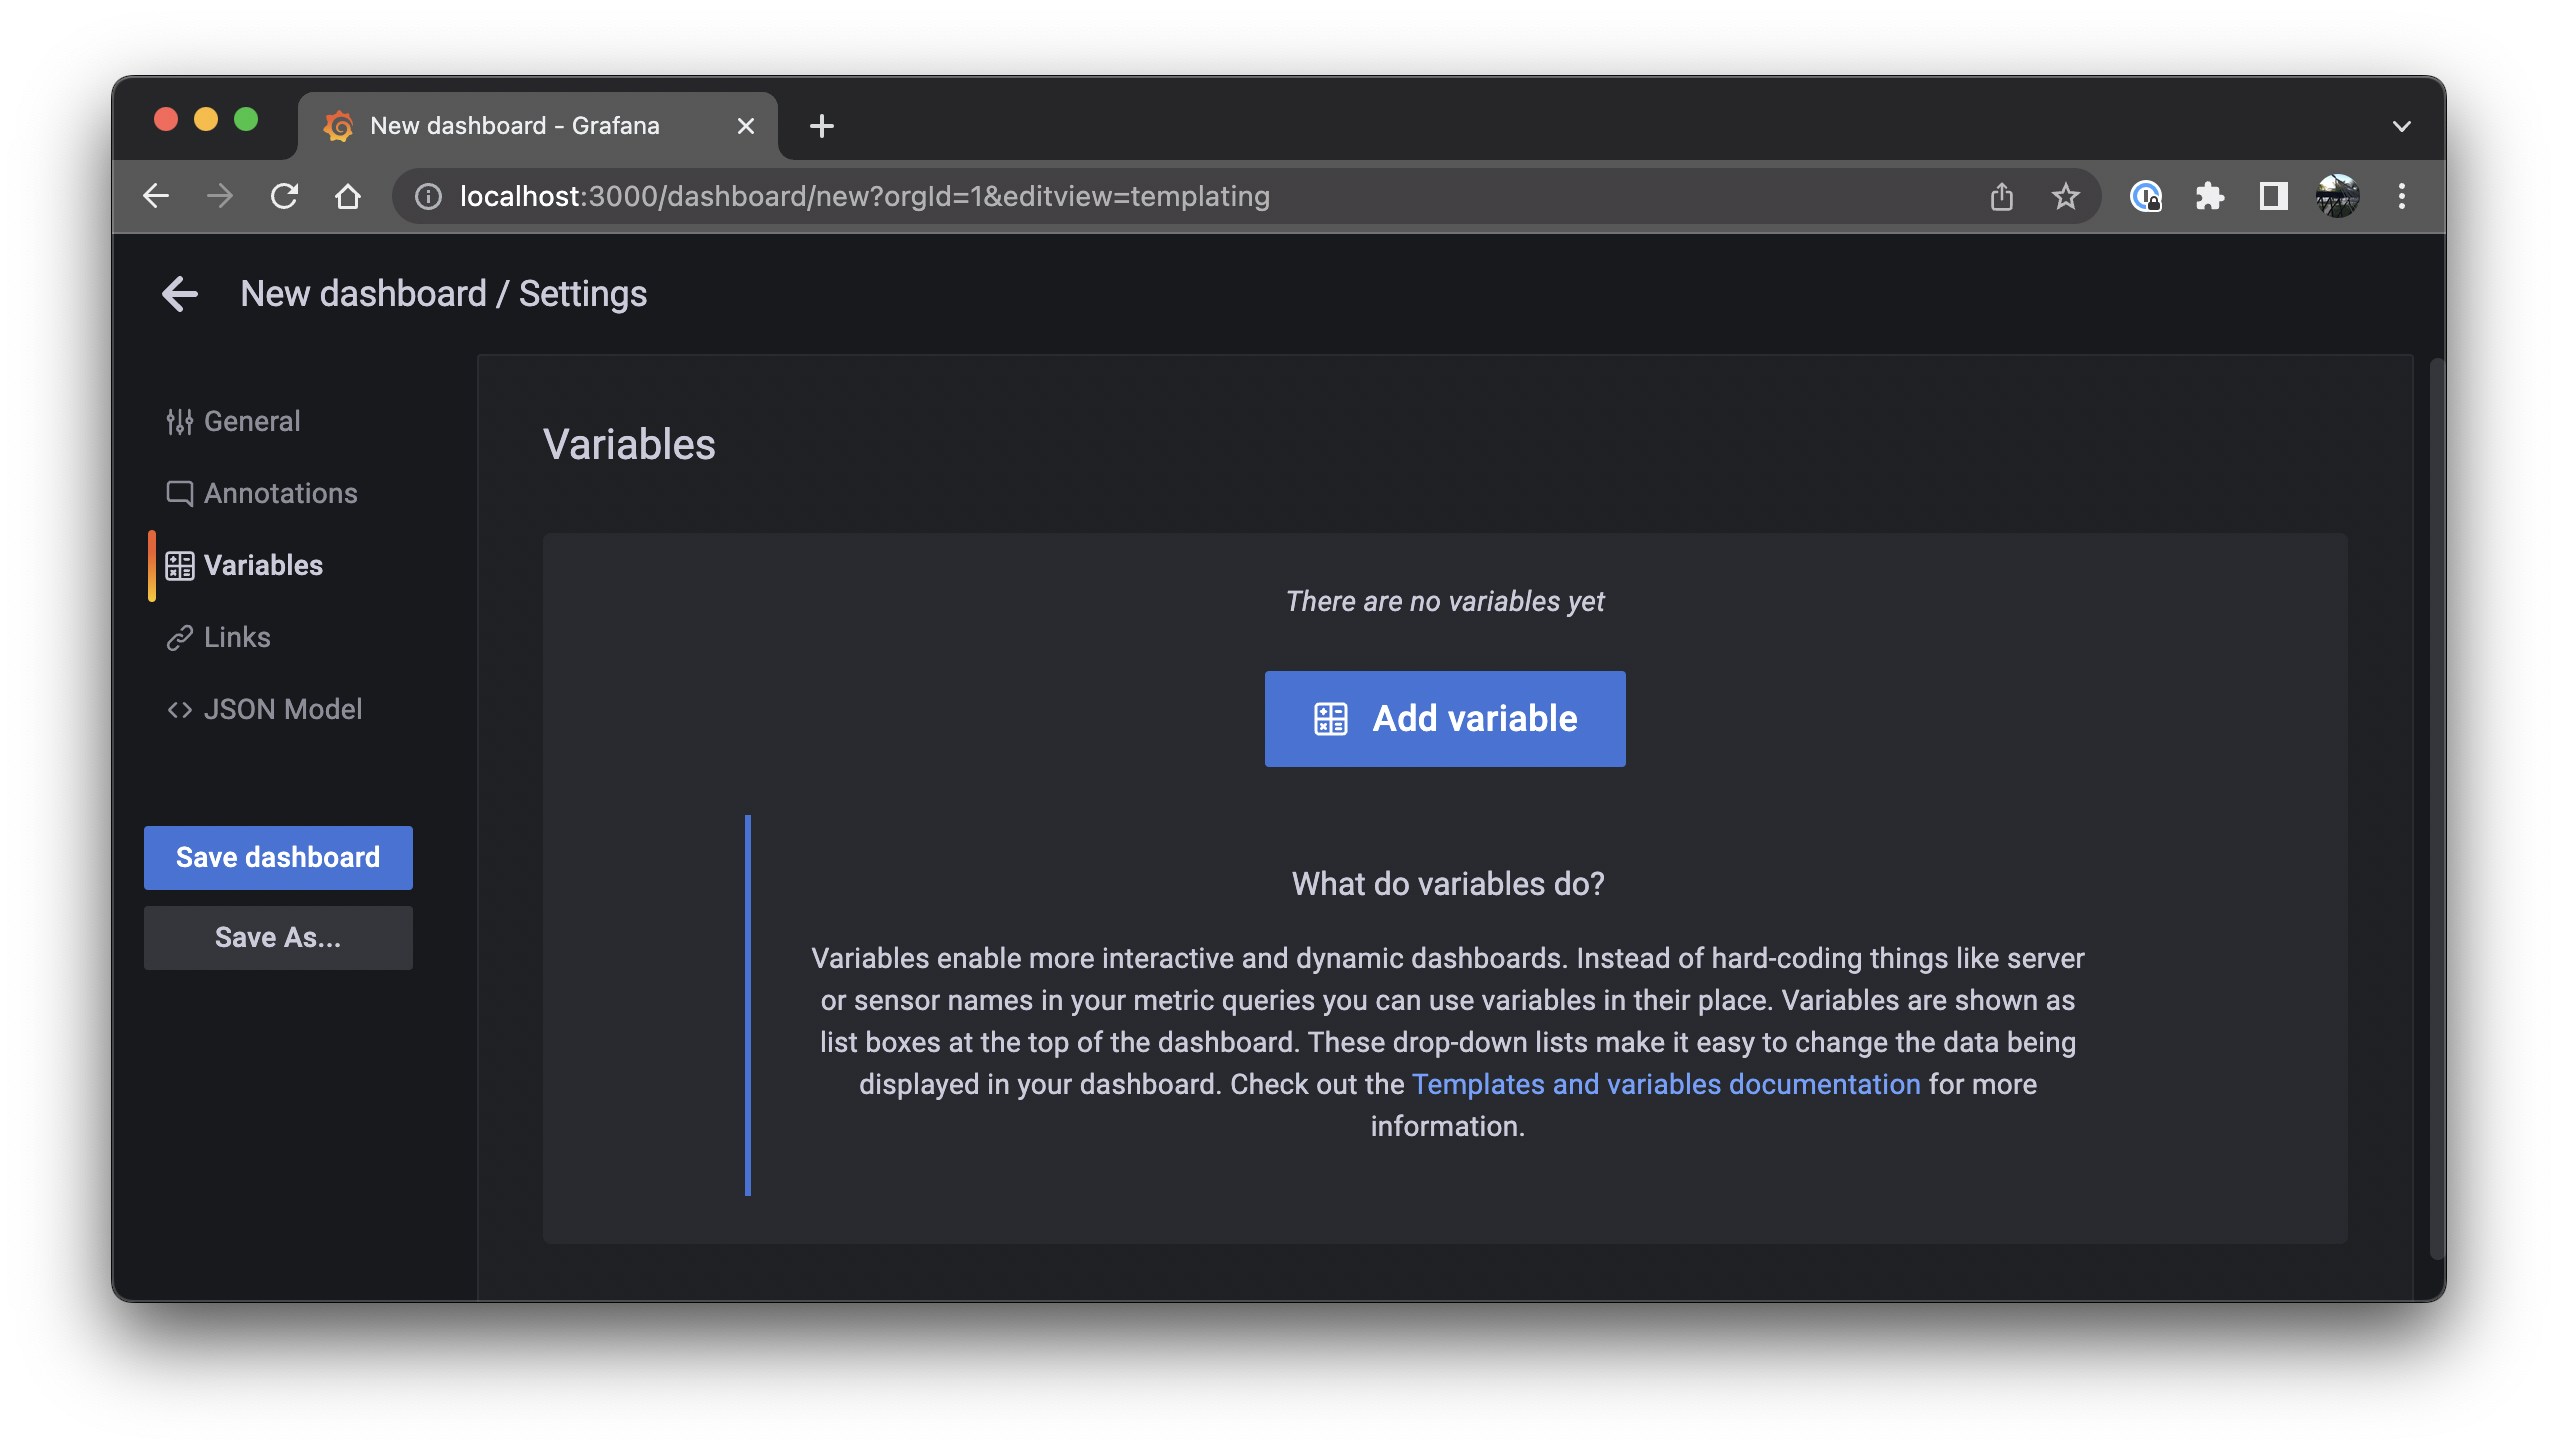
Select Dashboard settings > Variables and click the Add variable button:
-
Enter
cloudfor Name,Cloudfor Label, andlabel_values(cloud)for Query. Toggle Multi-value and Include All option to enable both selection options. Ensure that the Preview of values at the bottom displays the available clouds, then click the Update button.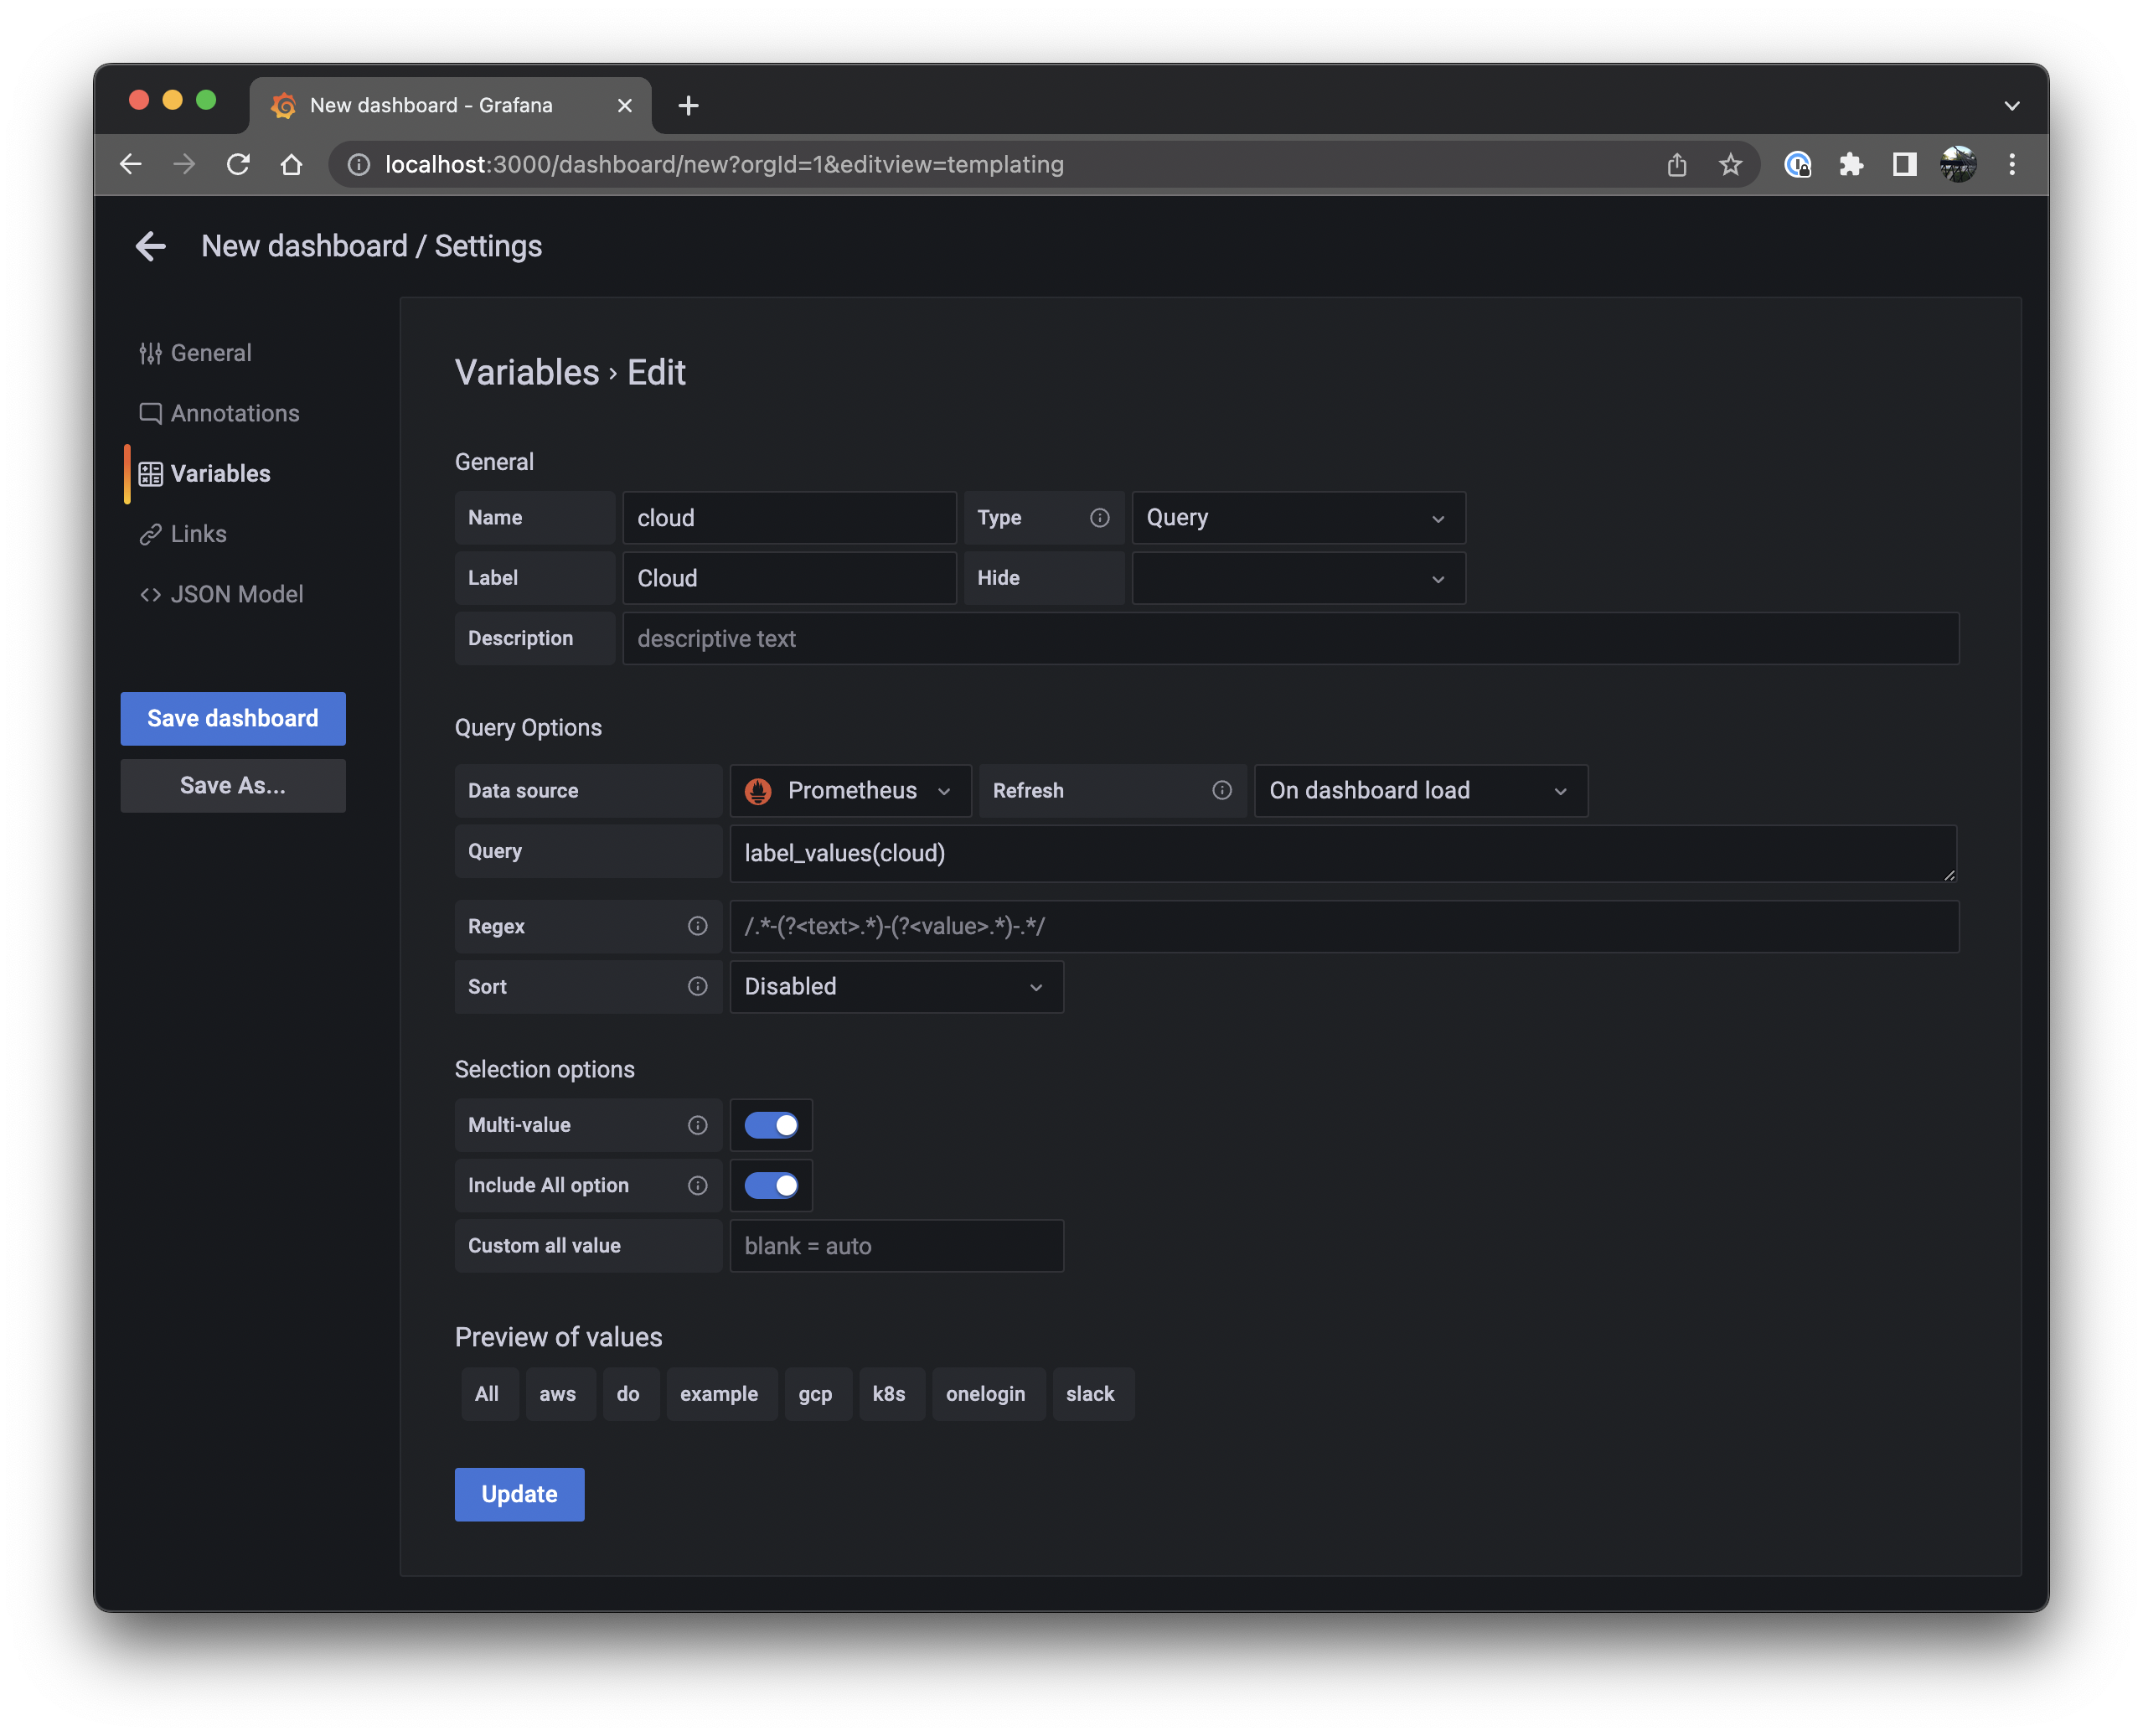
-
Repeat steps 8 and 9, but with the following values:
Name Label Query Multi-value Include All option accountAccountlabel_values(account)✔️ ✔️ regionRegionlabel_values(region)✔️ ✔️ 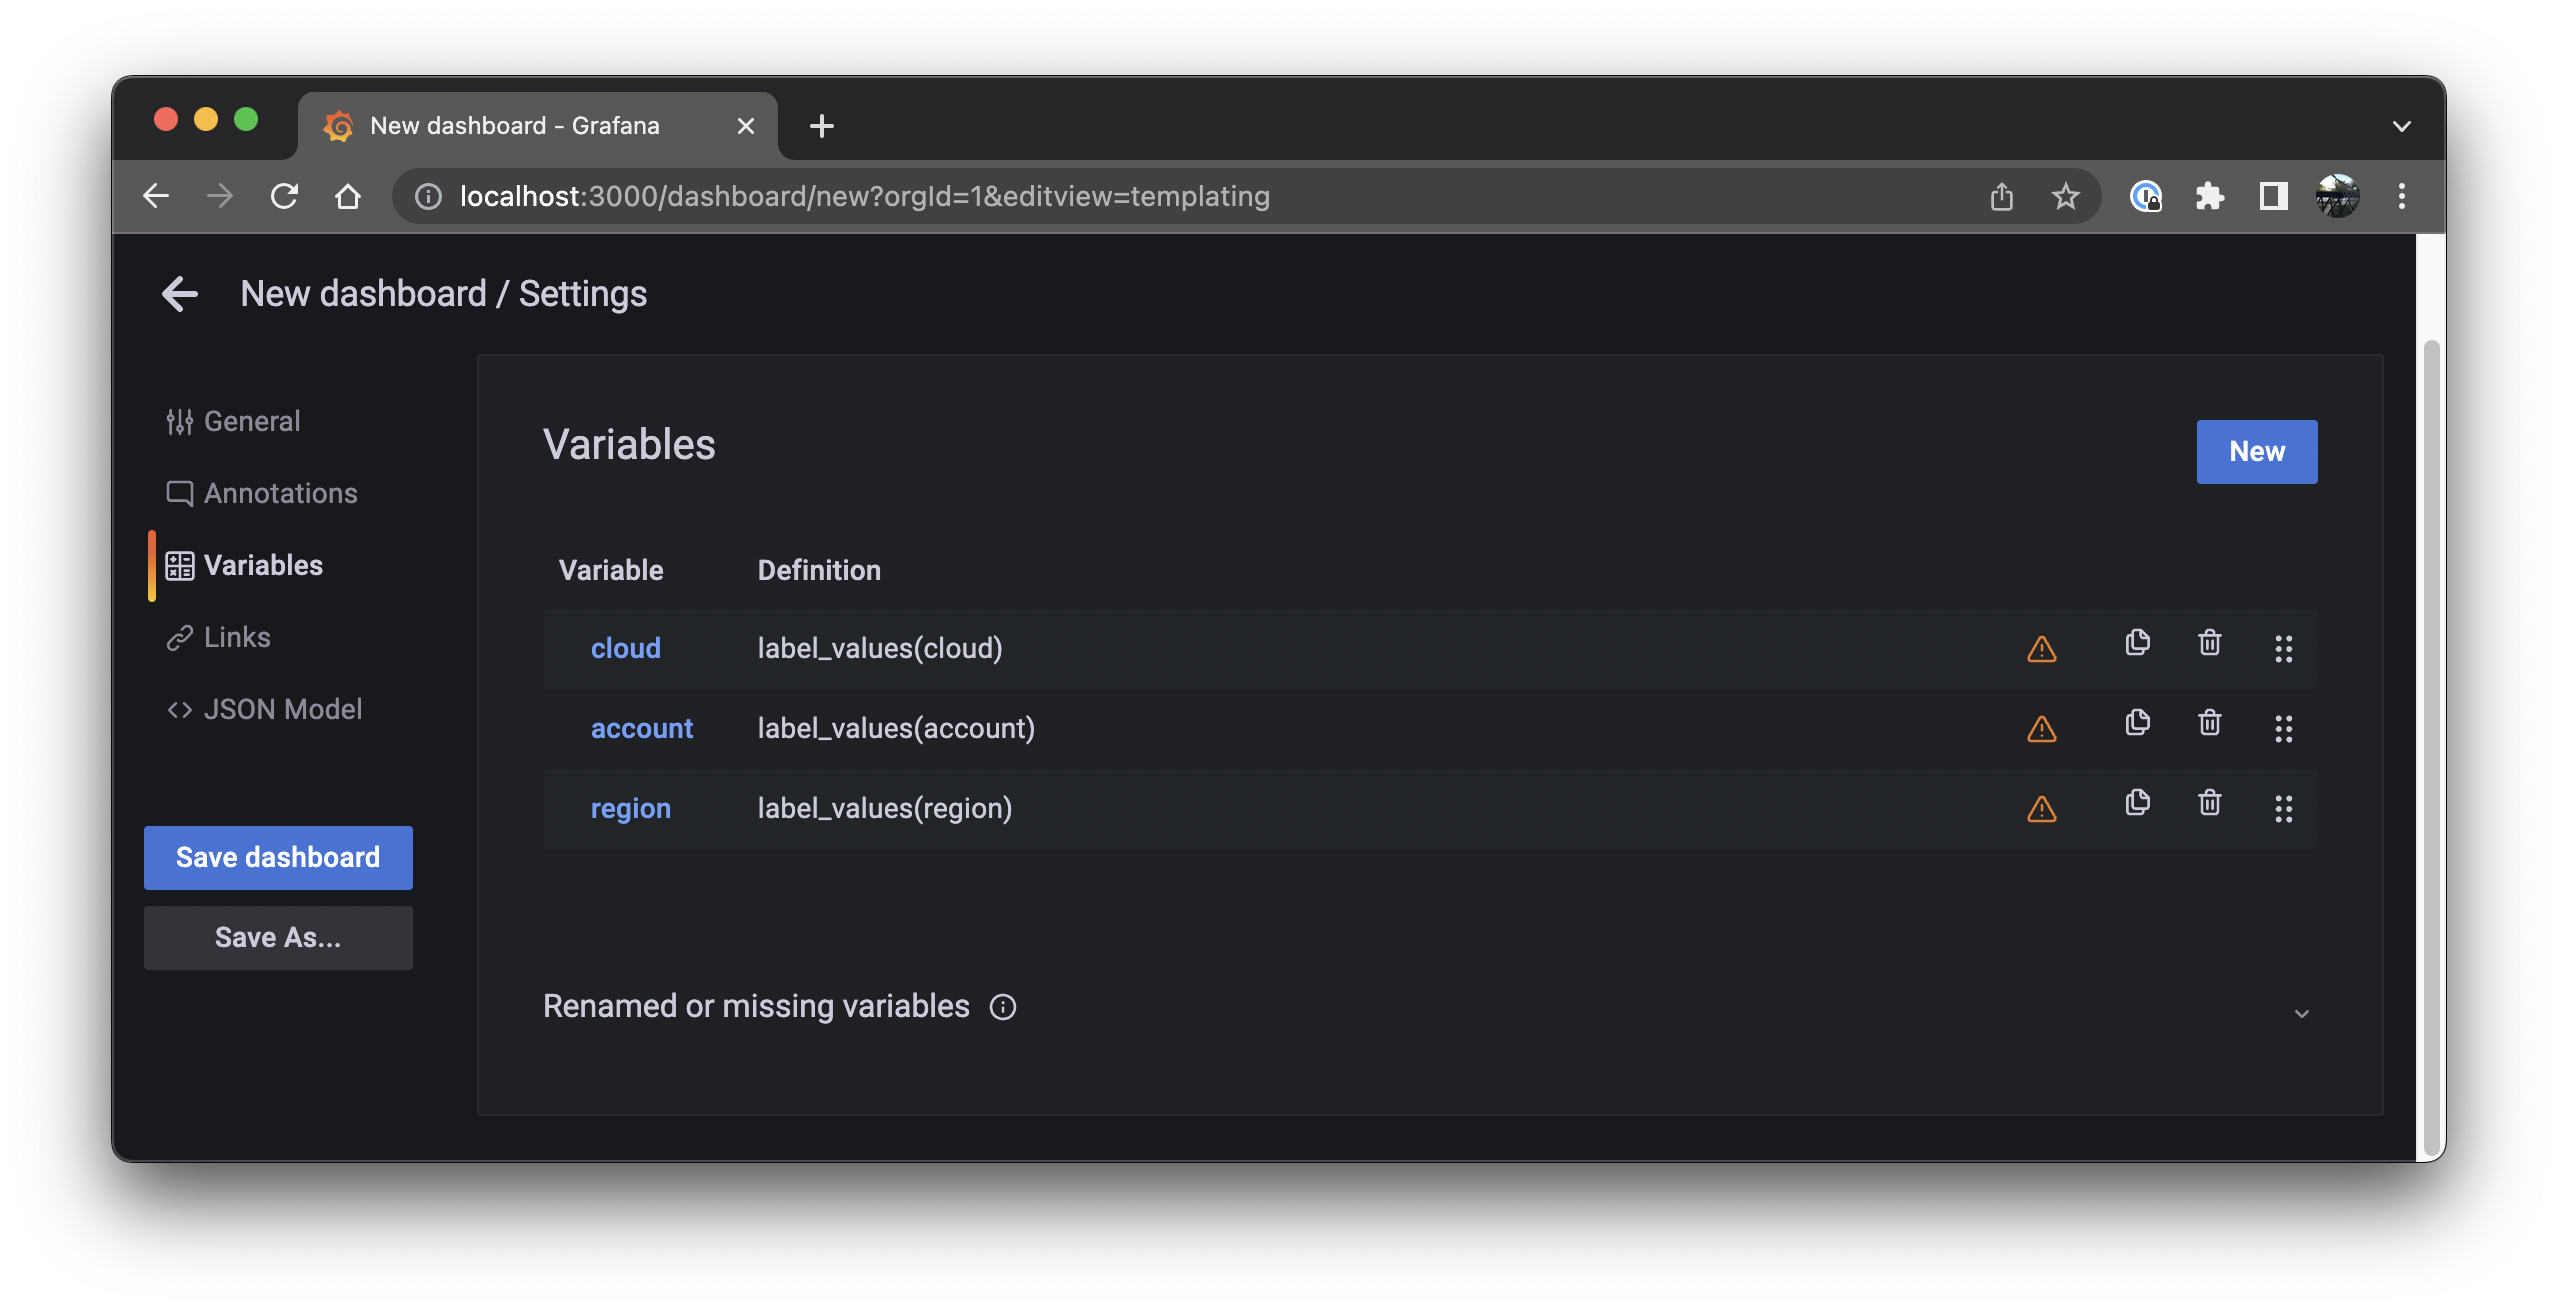
-
Hit
Escon your keyboard to go back, then click Add new panel.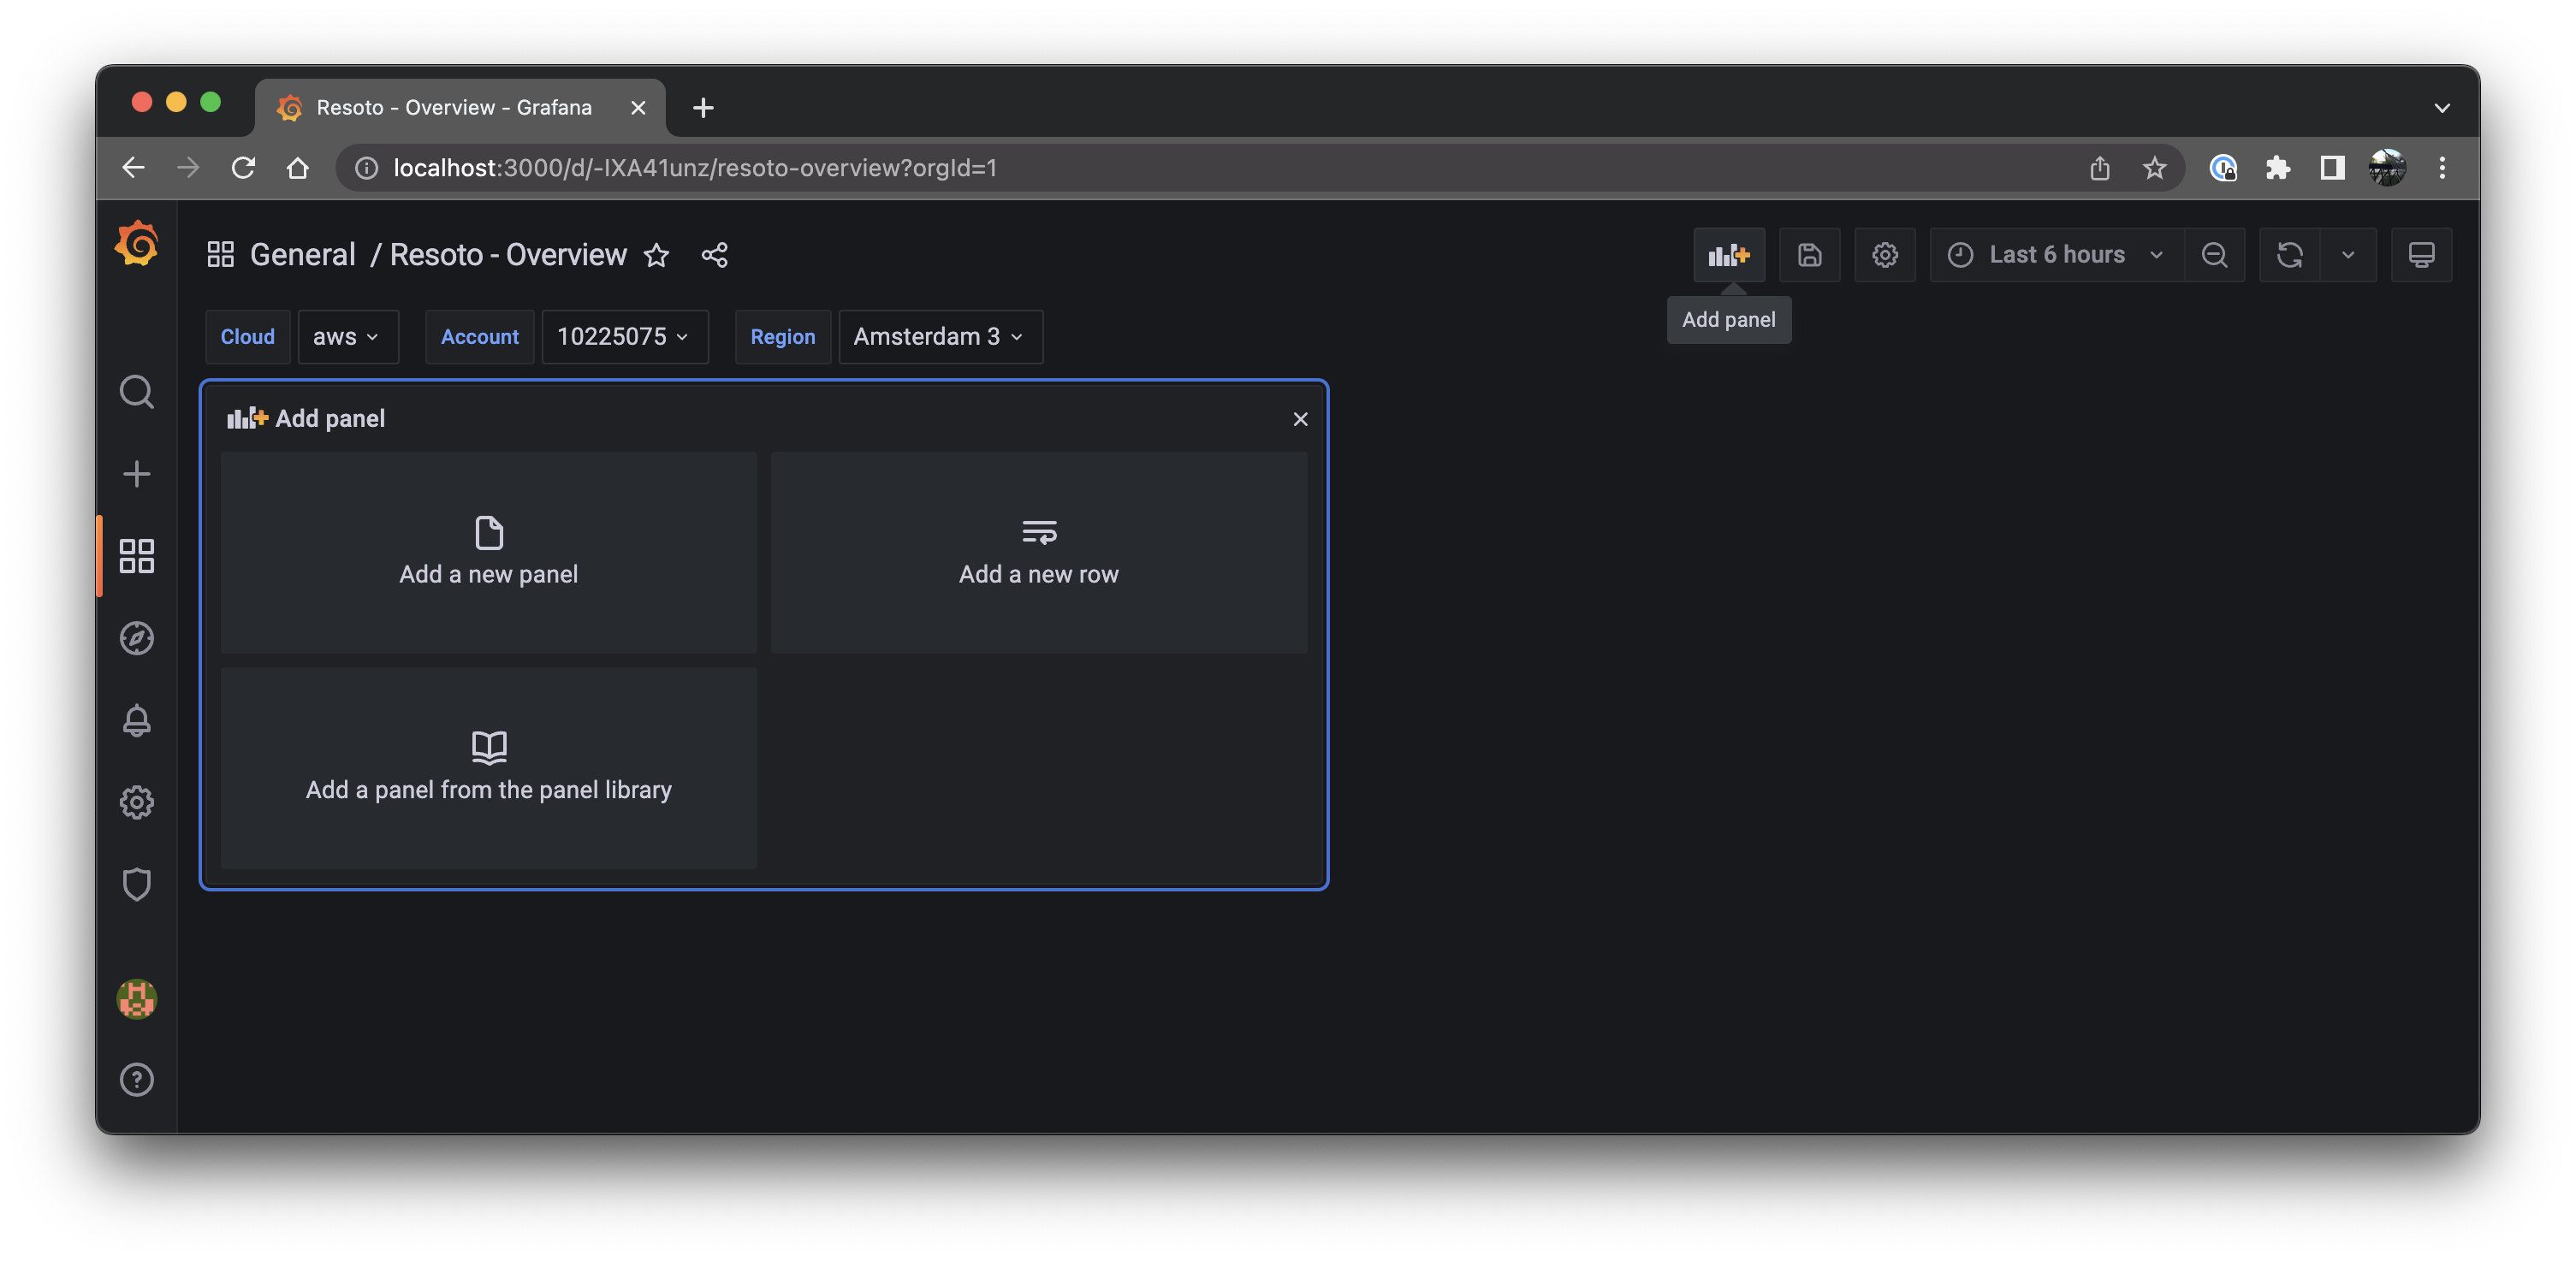
-
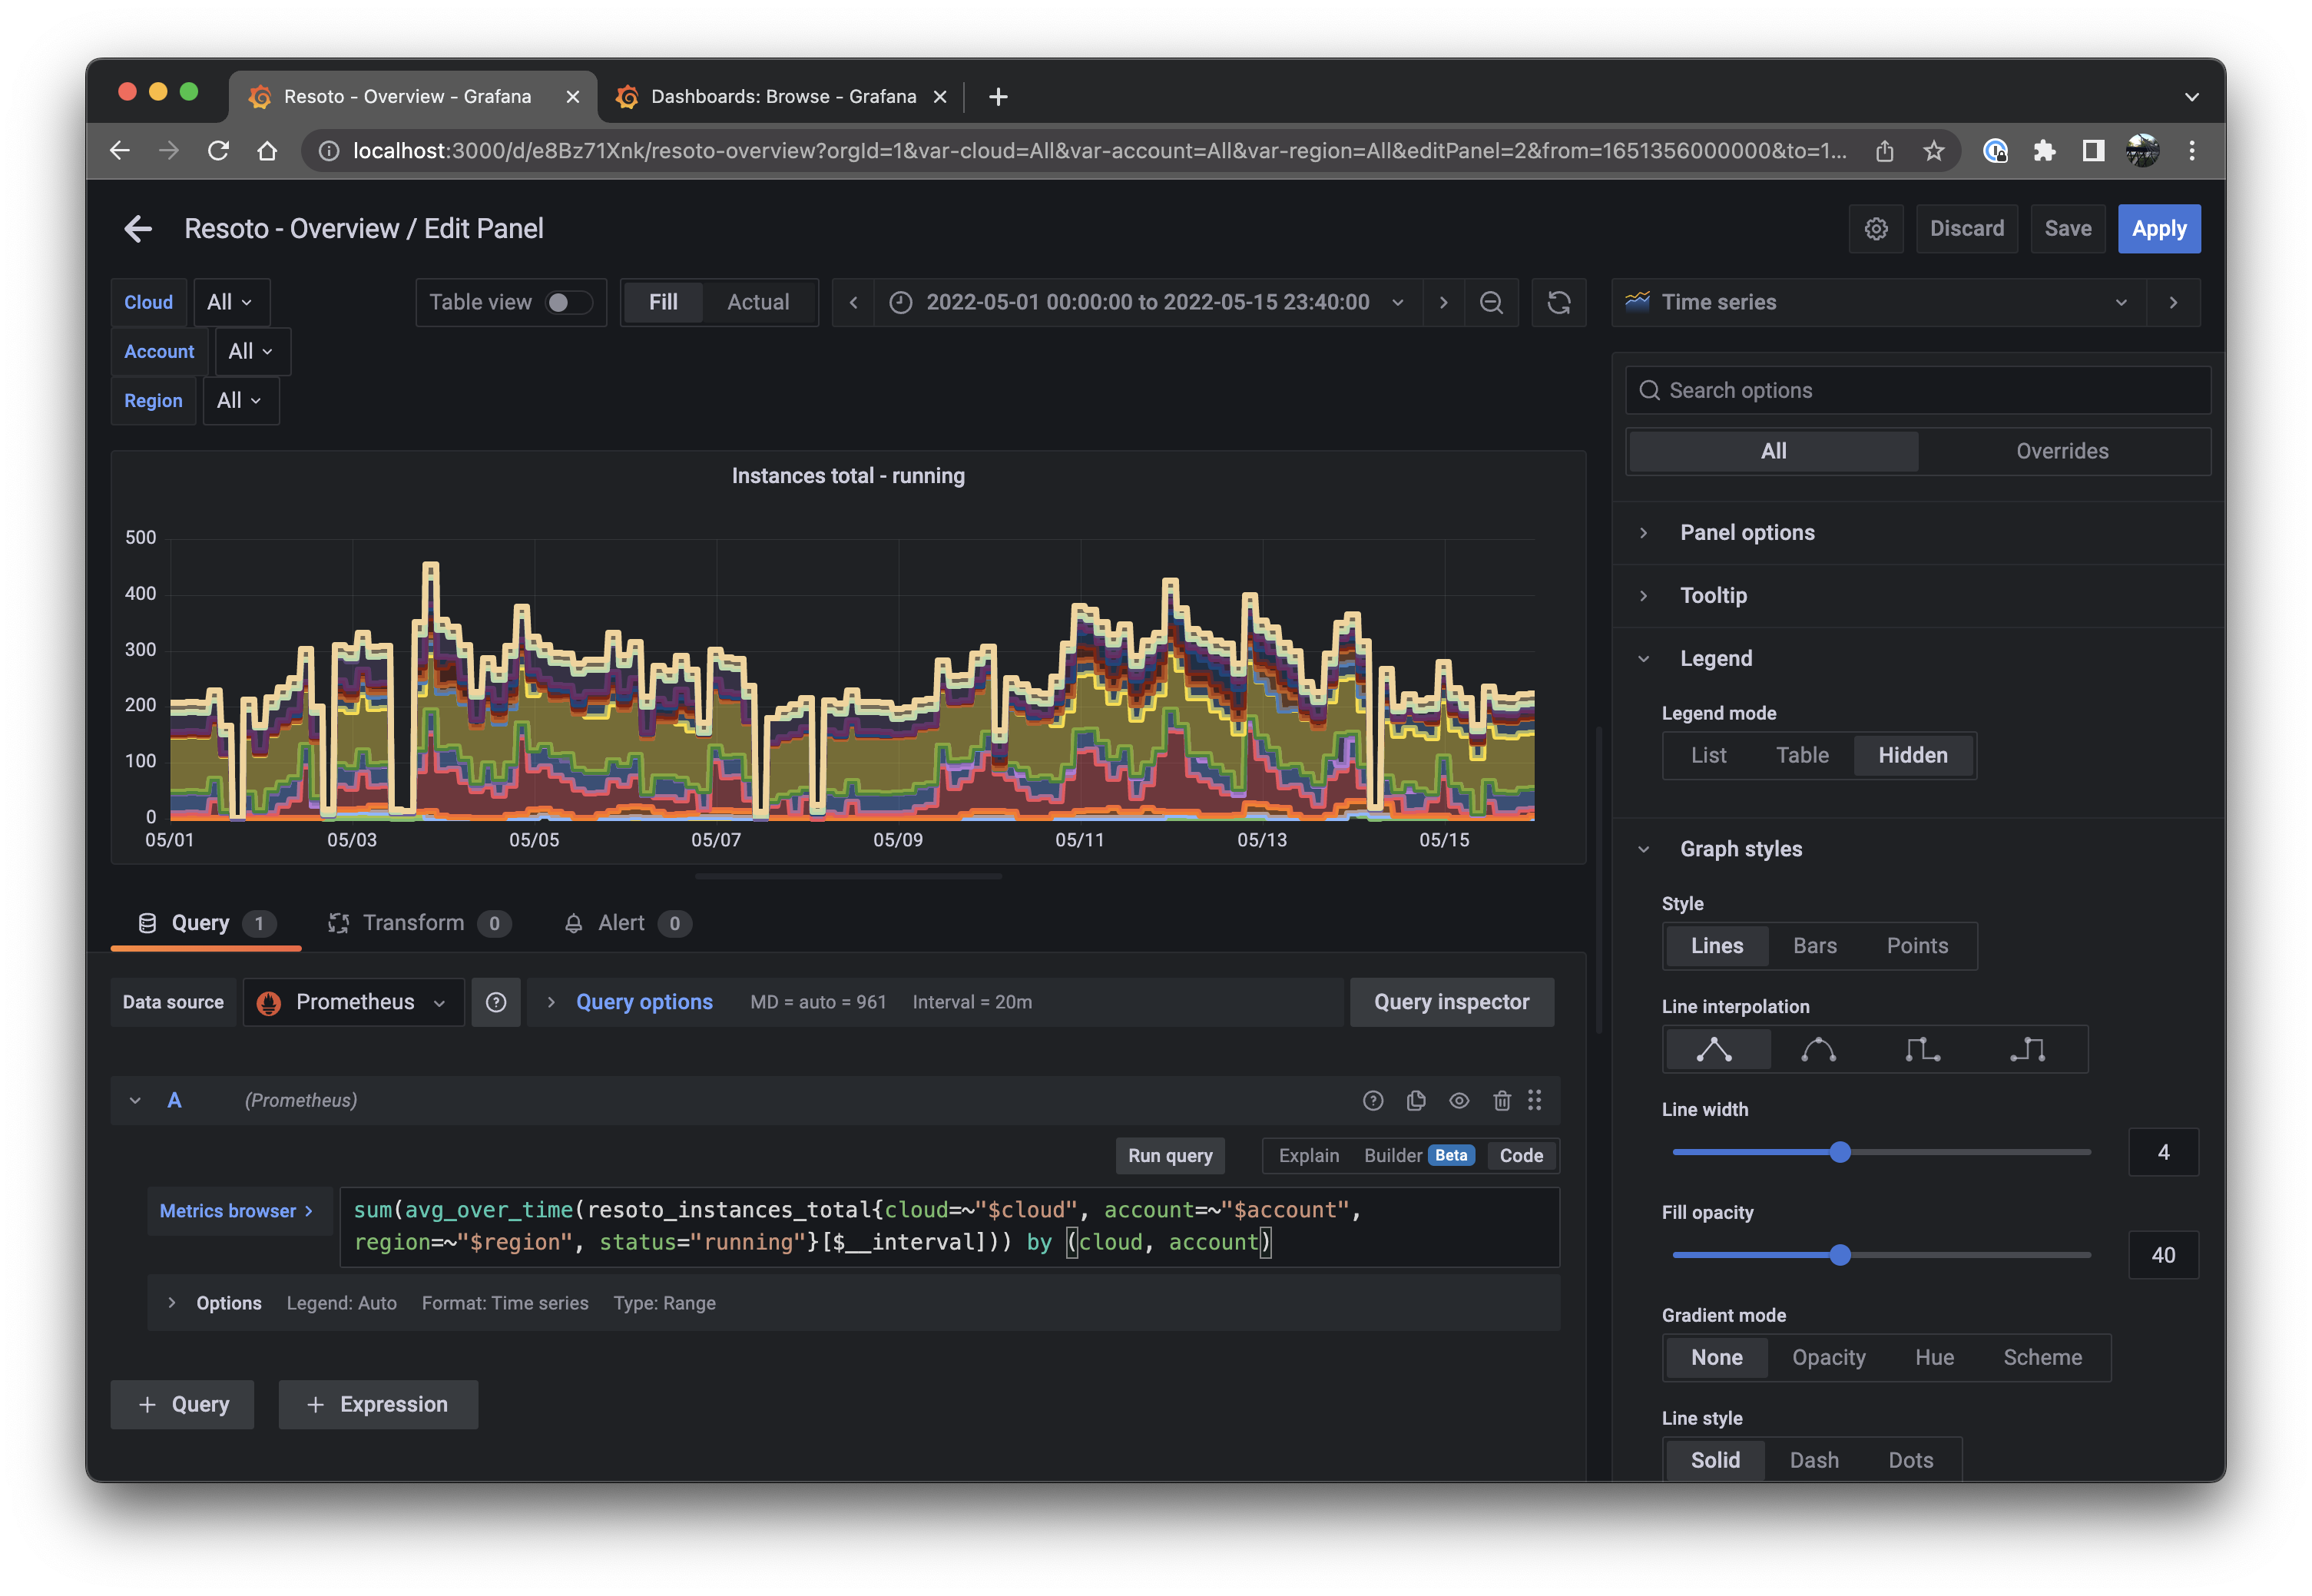
Copy the following into the text box to the right of Metrics browser > in the Query tab:
sum(avg_over_time(resoto_instances_total{cloud=~"$cloud", account=~"$account", region=~"$region", status="running"}[$__interval])) by (cloud, account)"Time Series" should be selected in the dropdown at the top right. Configure the settings underneath as follows:
Setting Value Panel options > Title Instances Total - runningTooltip > Tooltip mode All Tooltip > Values sort order Descending Legend > Legend mode Hidden Graph styles > Line width 4 Graph styles > Fill opacity 40 Graph styles > Connect null values Always Graph styles > Stack series Normal Click the Save button, then the Apply button.
You now have a functional dashboard!
 info
infoDon't forget to click the
Savebutton any time you make changes to the dashboard! -
Now, we'll add a second panel. Again, click Add new panel.
Copy the following into the text box to the right of Metrics browser > in the Query tab:
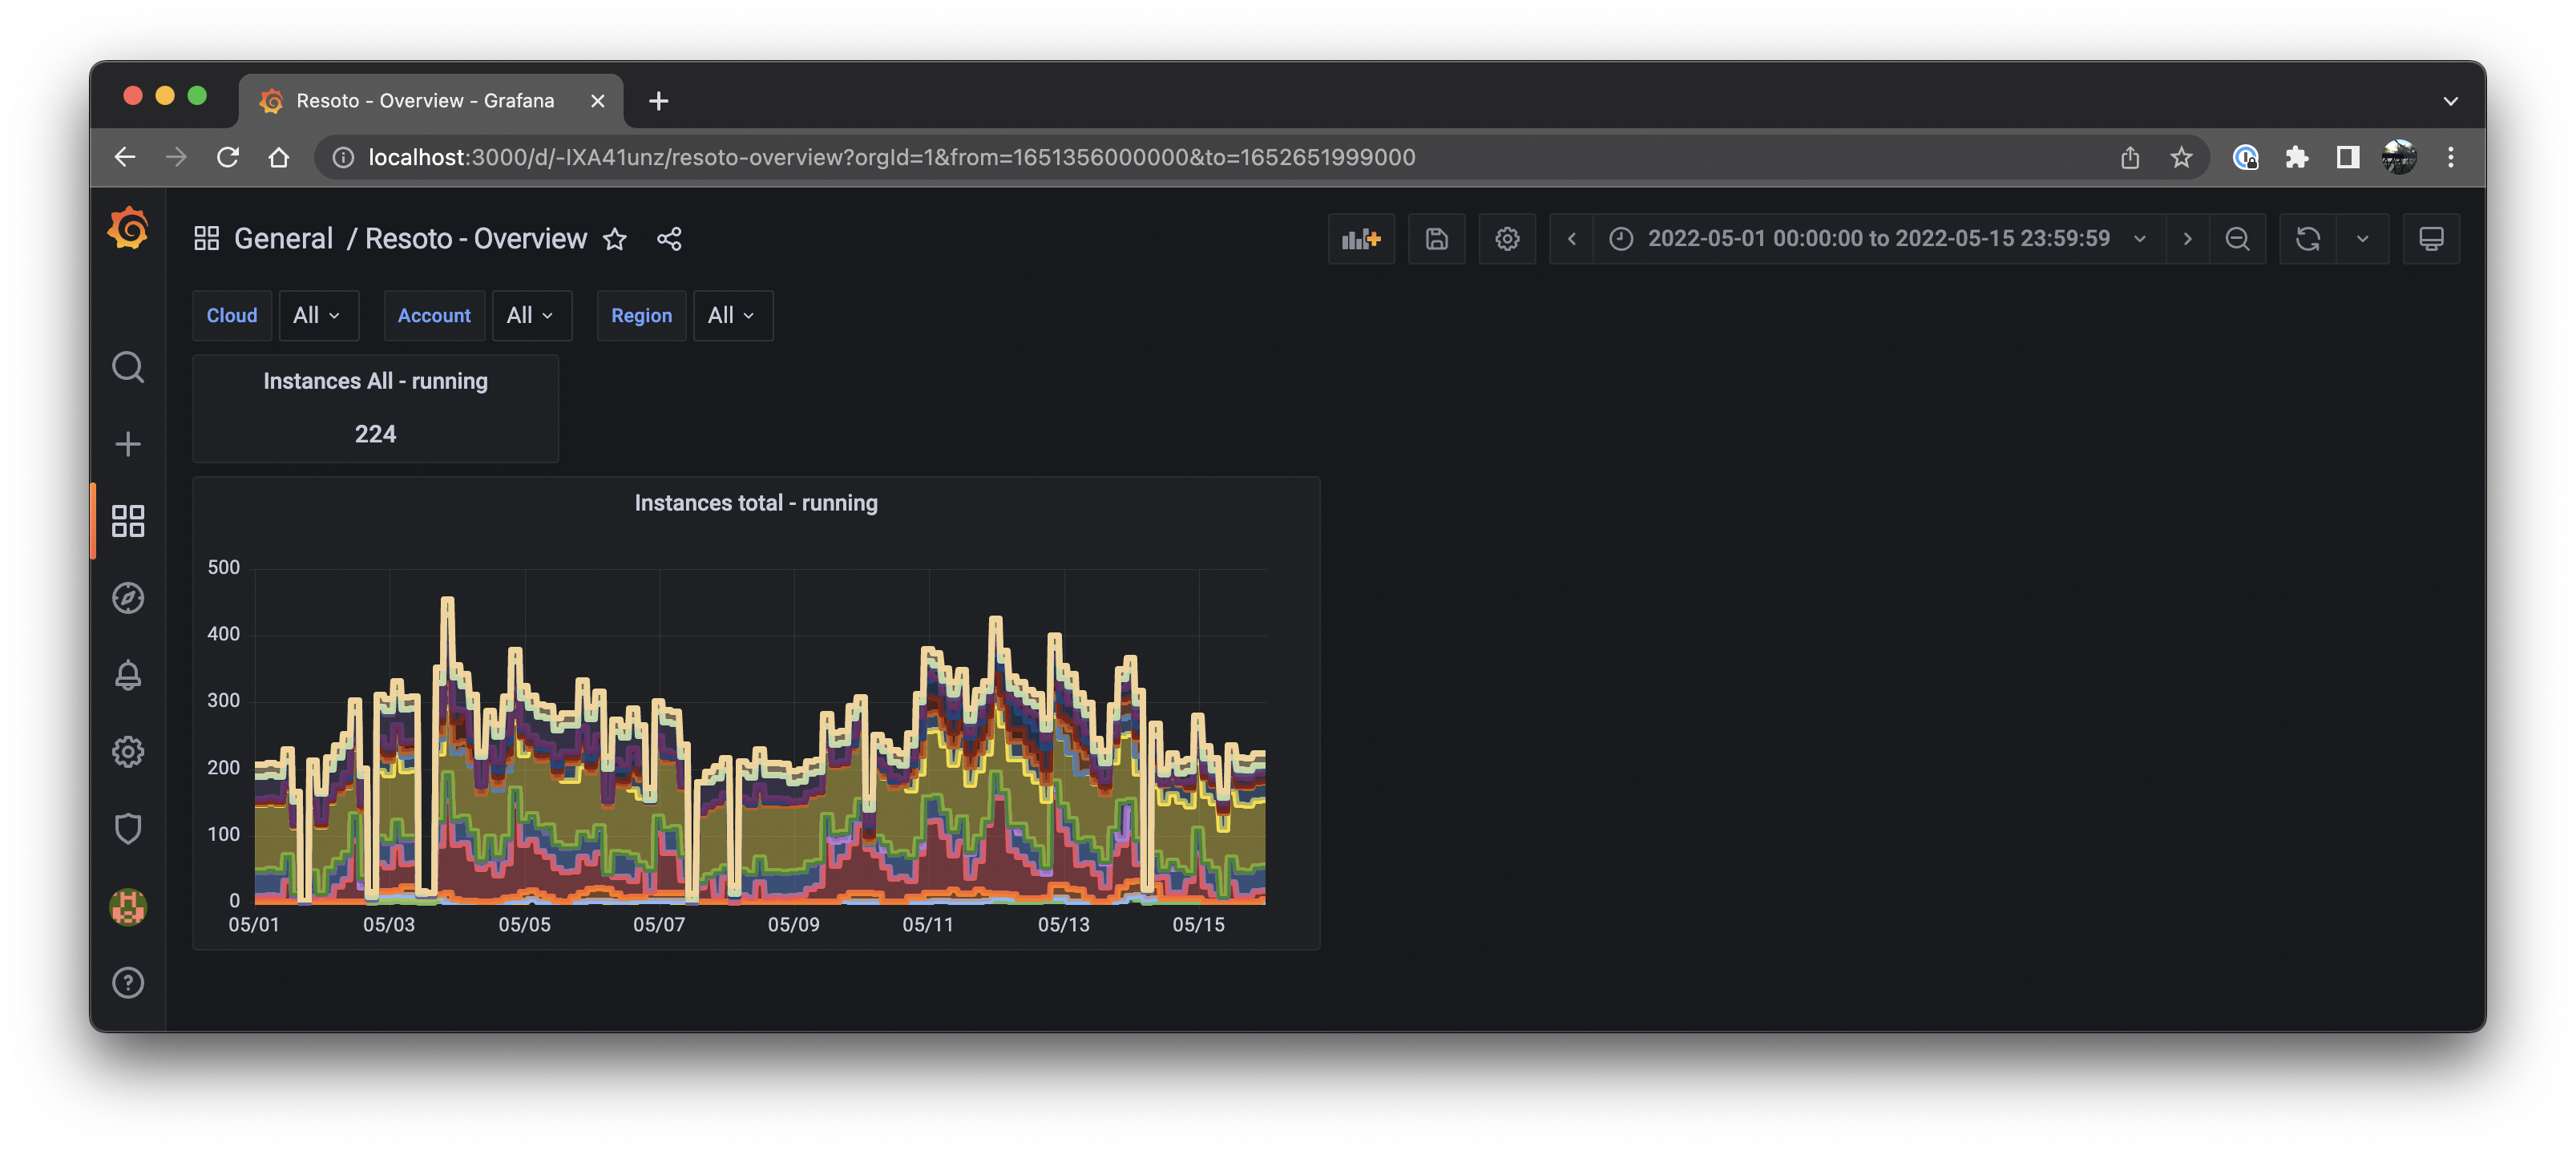
sum(avg_over_time(resoto_instances_total{cloud=~"$cloud", region=~"$region", account=~"$account", status="running"}[$__interval]))Select Stats in the panel type dropdown at the top right. Then, configure the settings underneath as follows:
Setting Value Panel options > Title Instances $cloud - runningValue options > Calulation Last * Stat styles > Color mode None Stat styles > Graph mode None Click the Save button, then the Apply button.
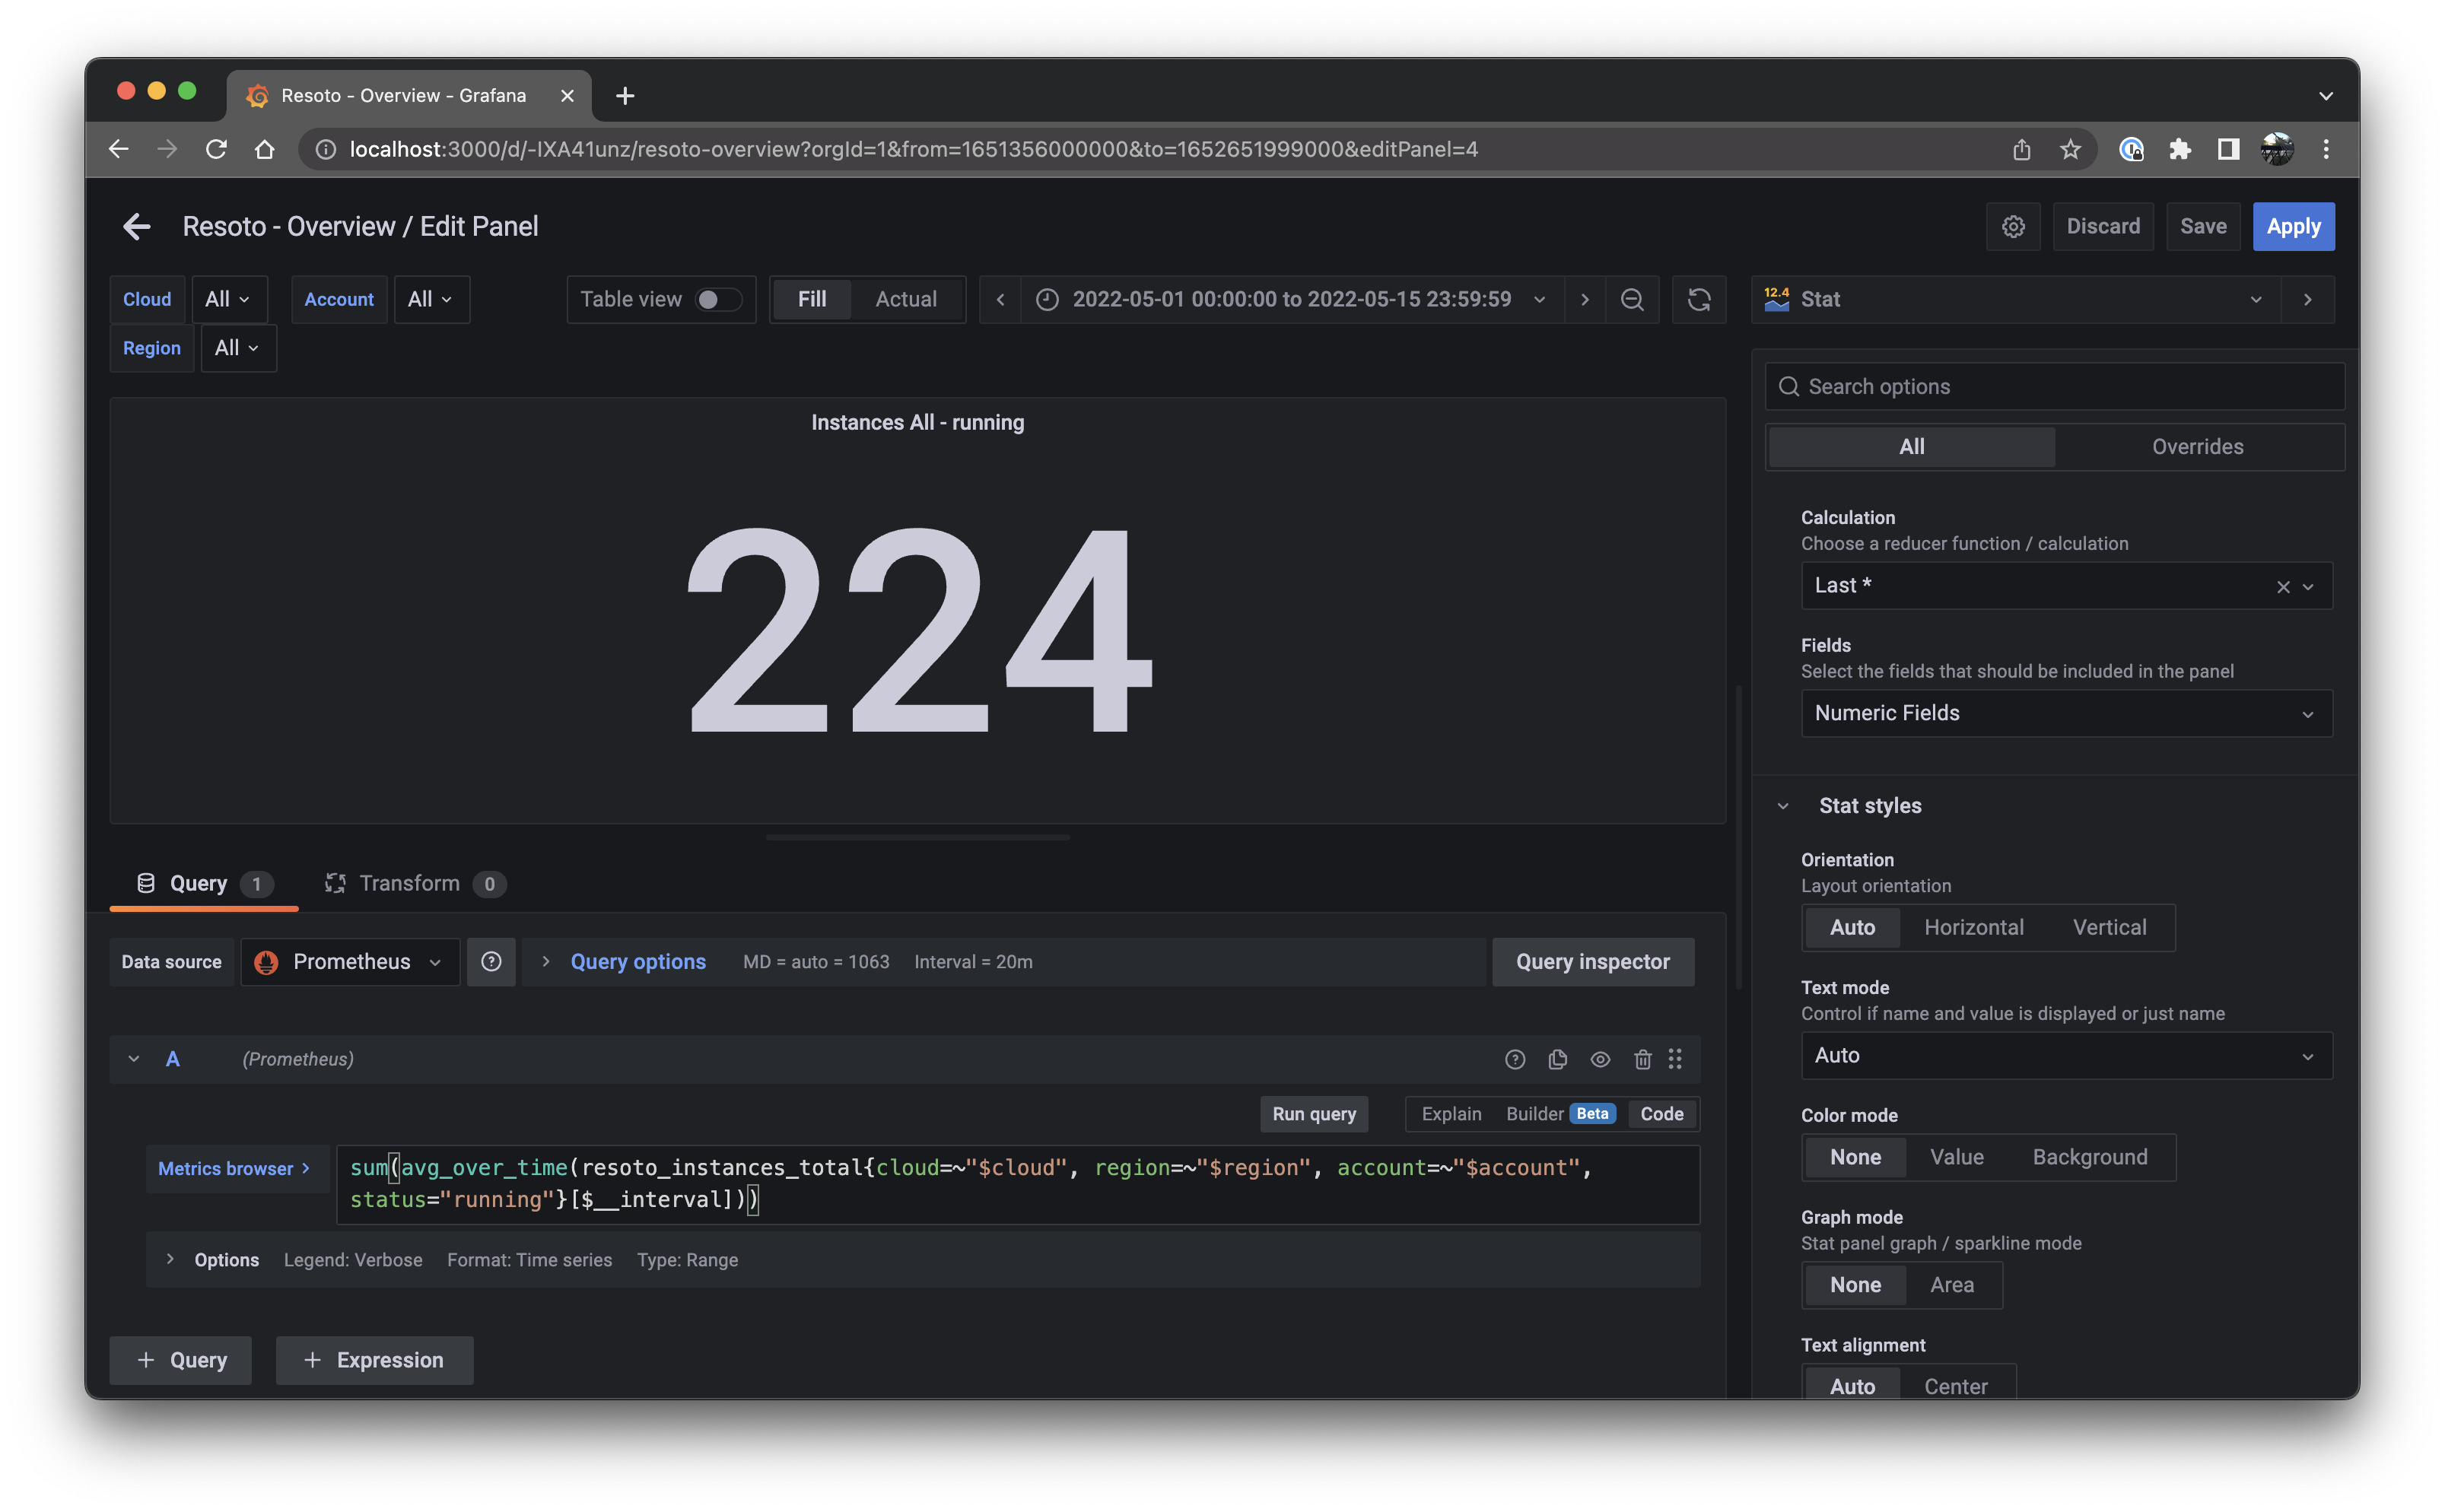
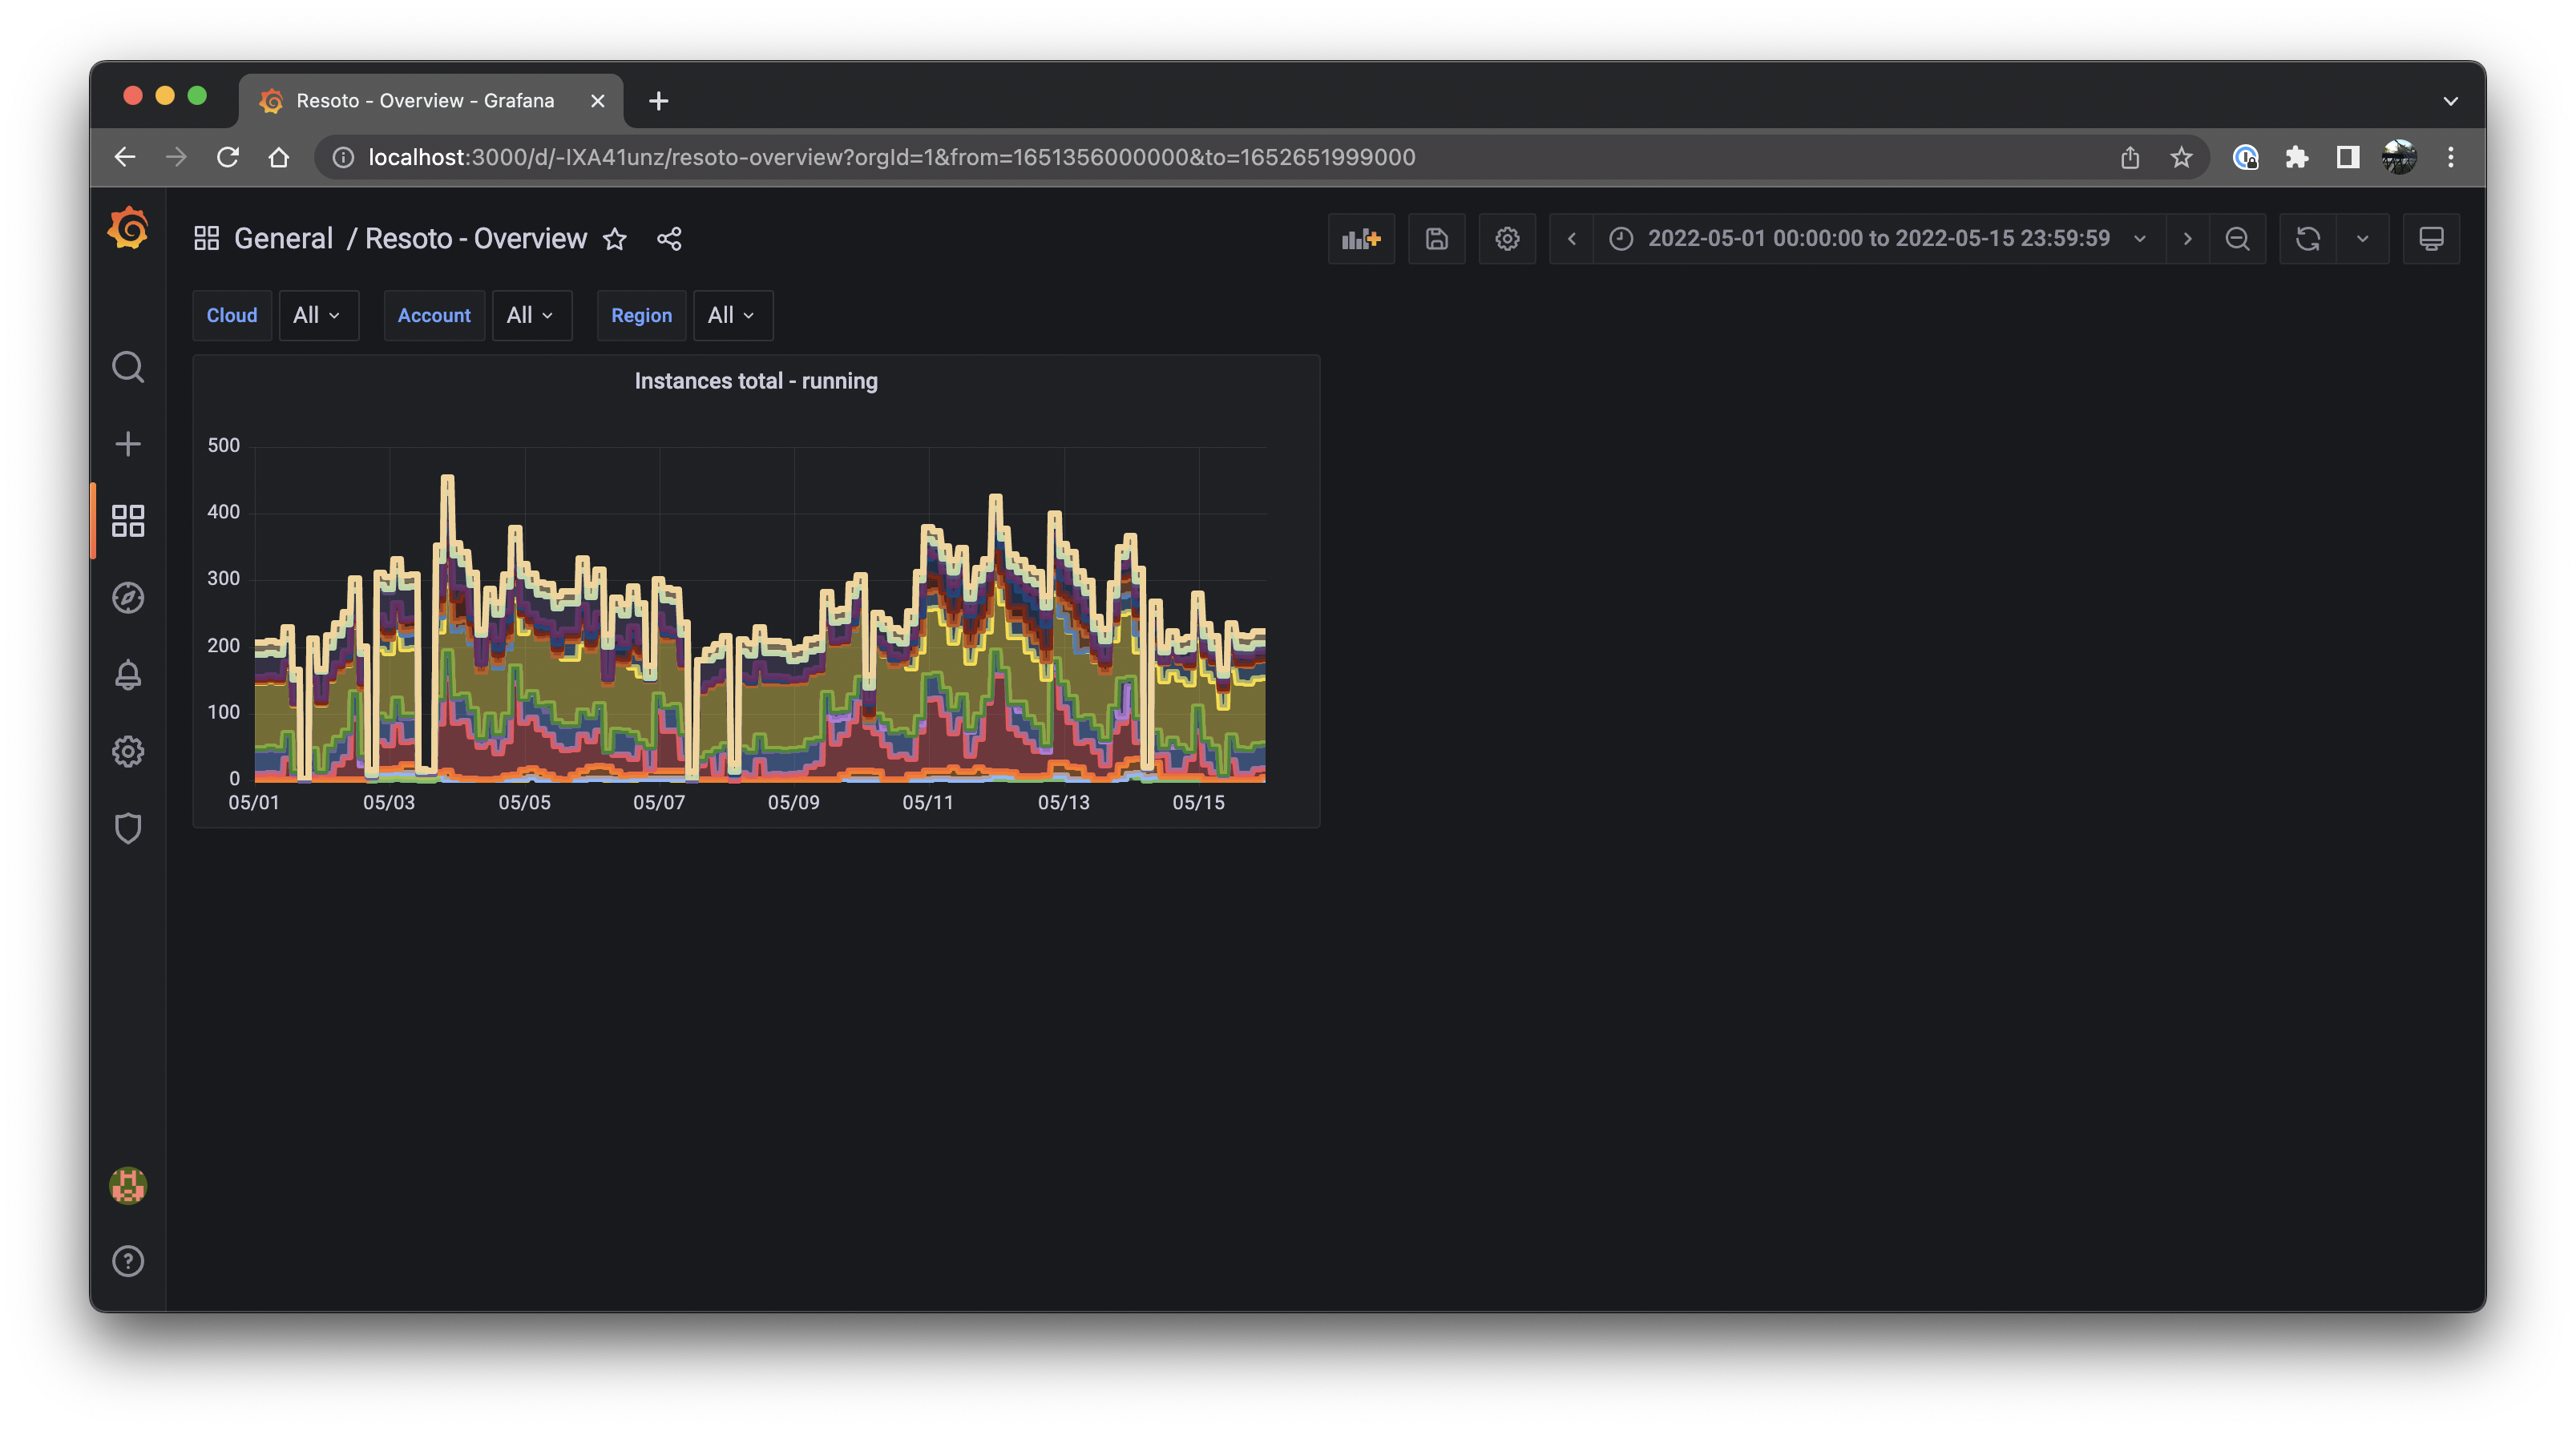
-
The dashboard now shows two panels; one showing the number of currently running instances, and another depicting the history of the number of instances:
The Final Product
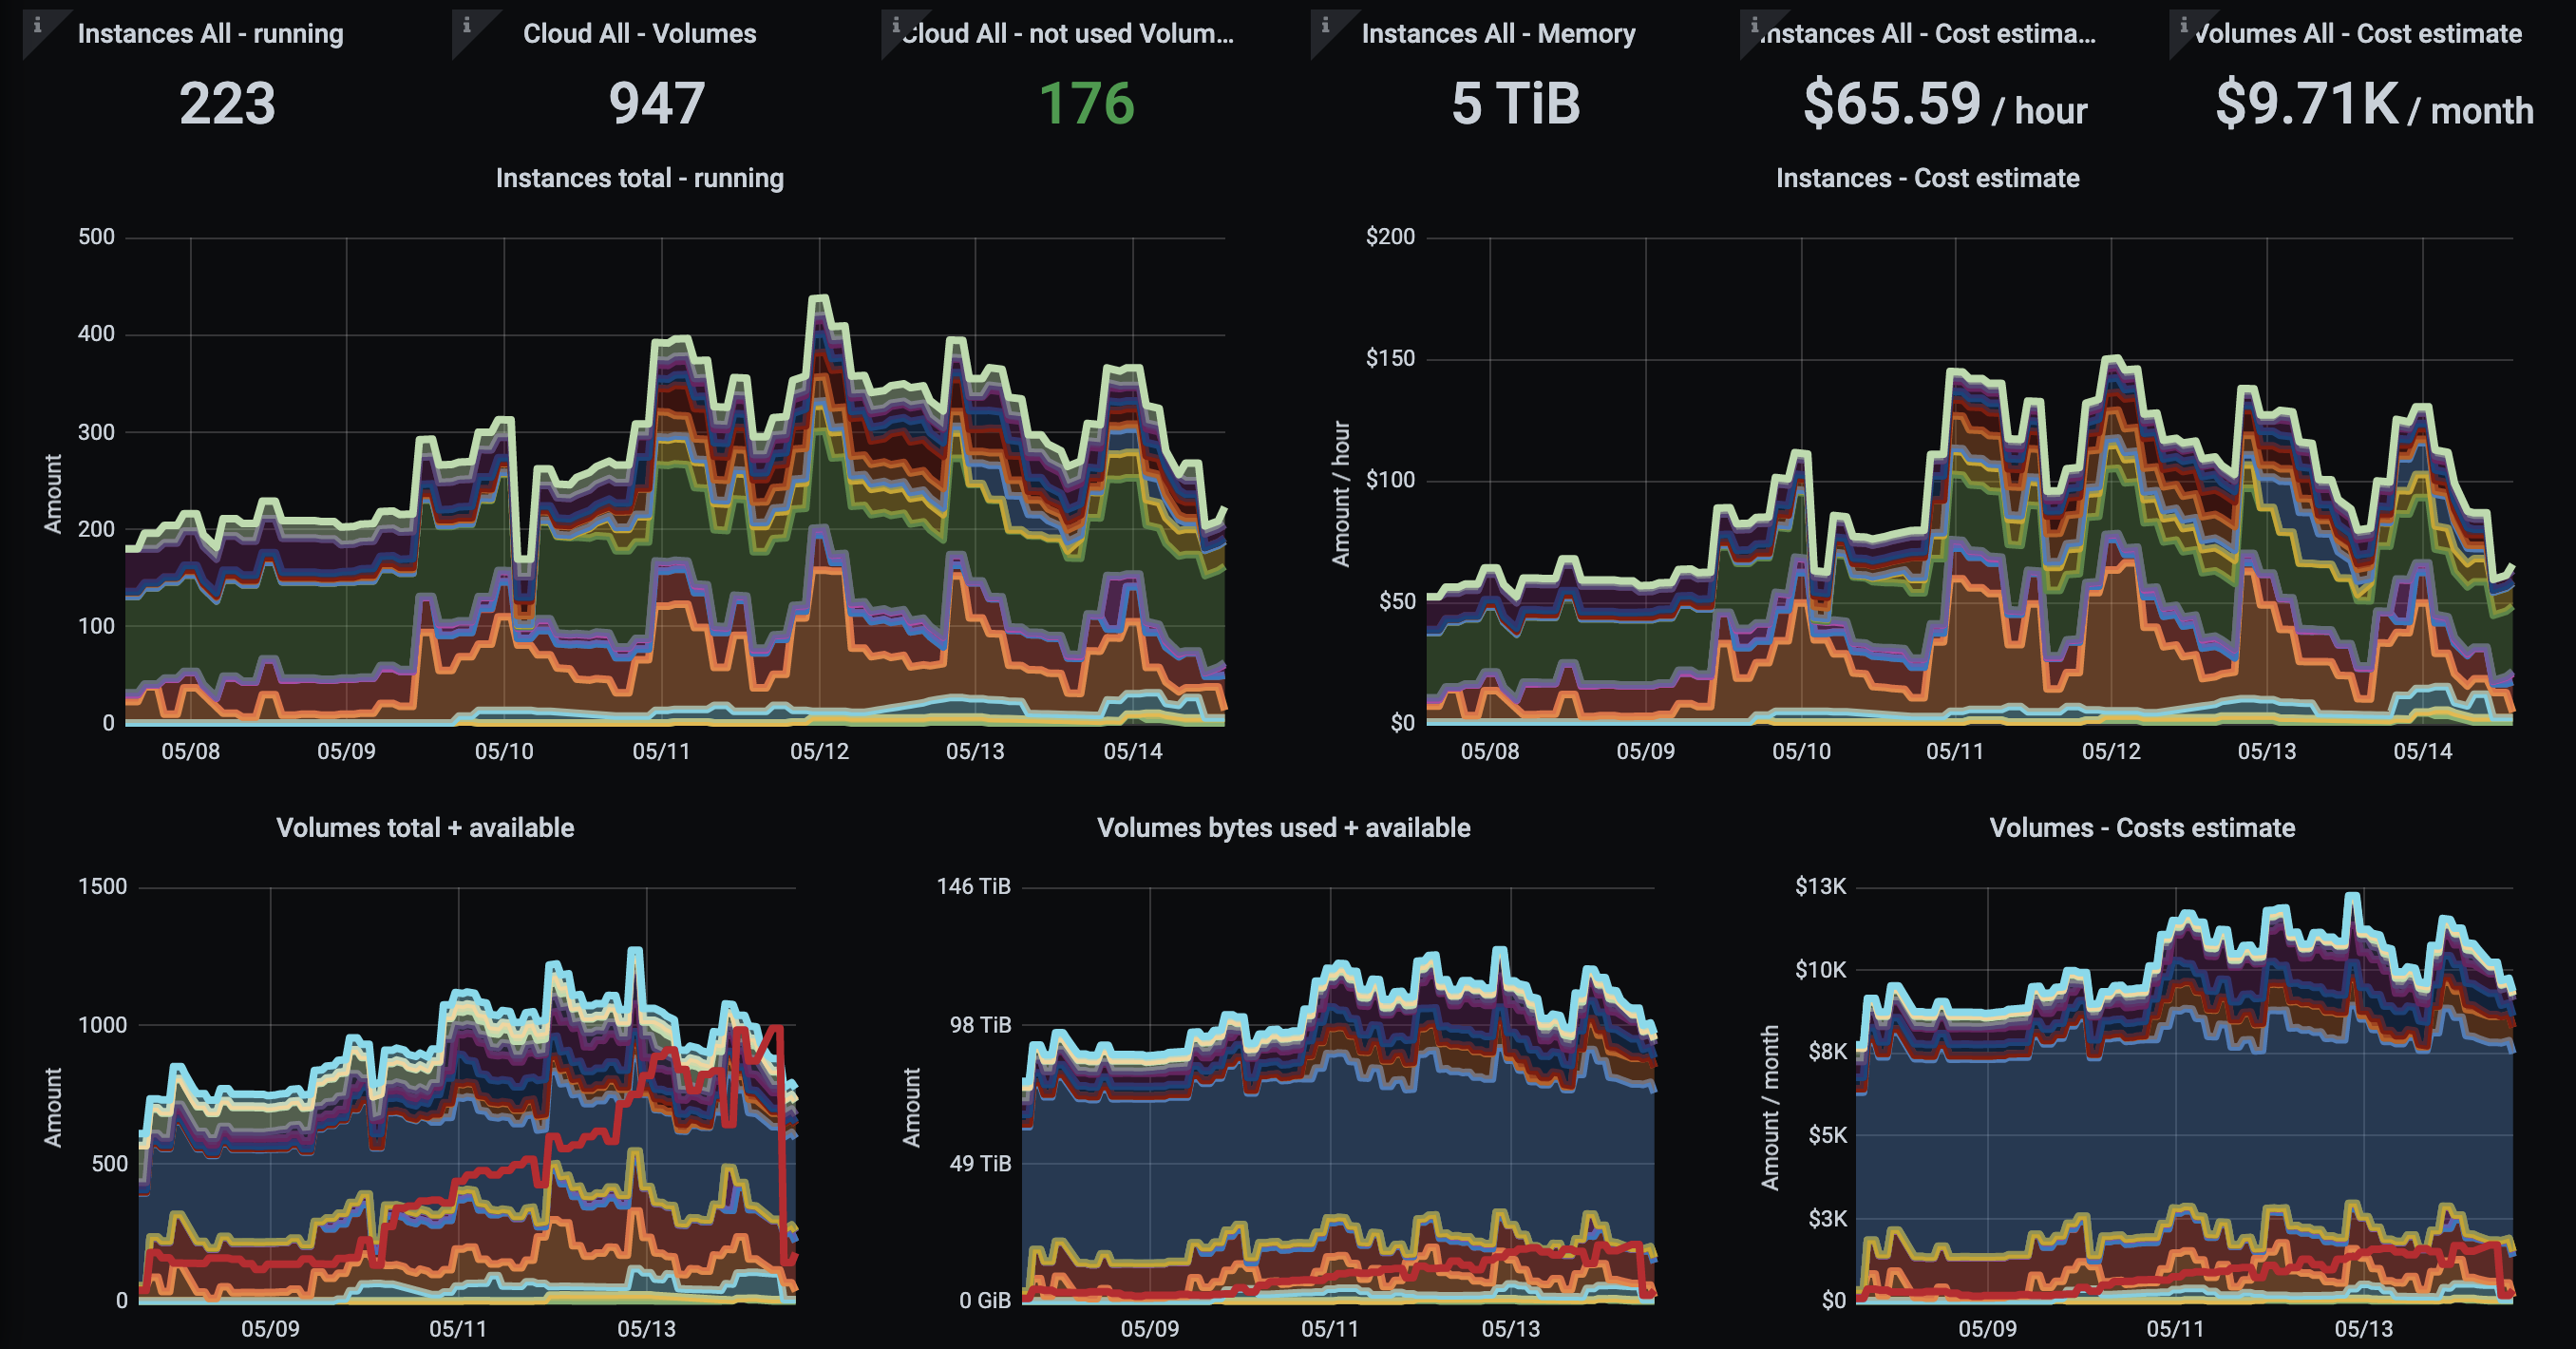
If we repeat the above steps for all of the metrics present in the configuration, the result is a dashboard that looks like this:
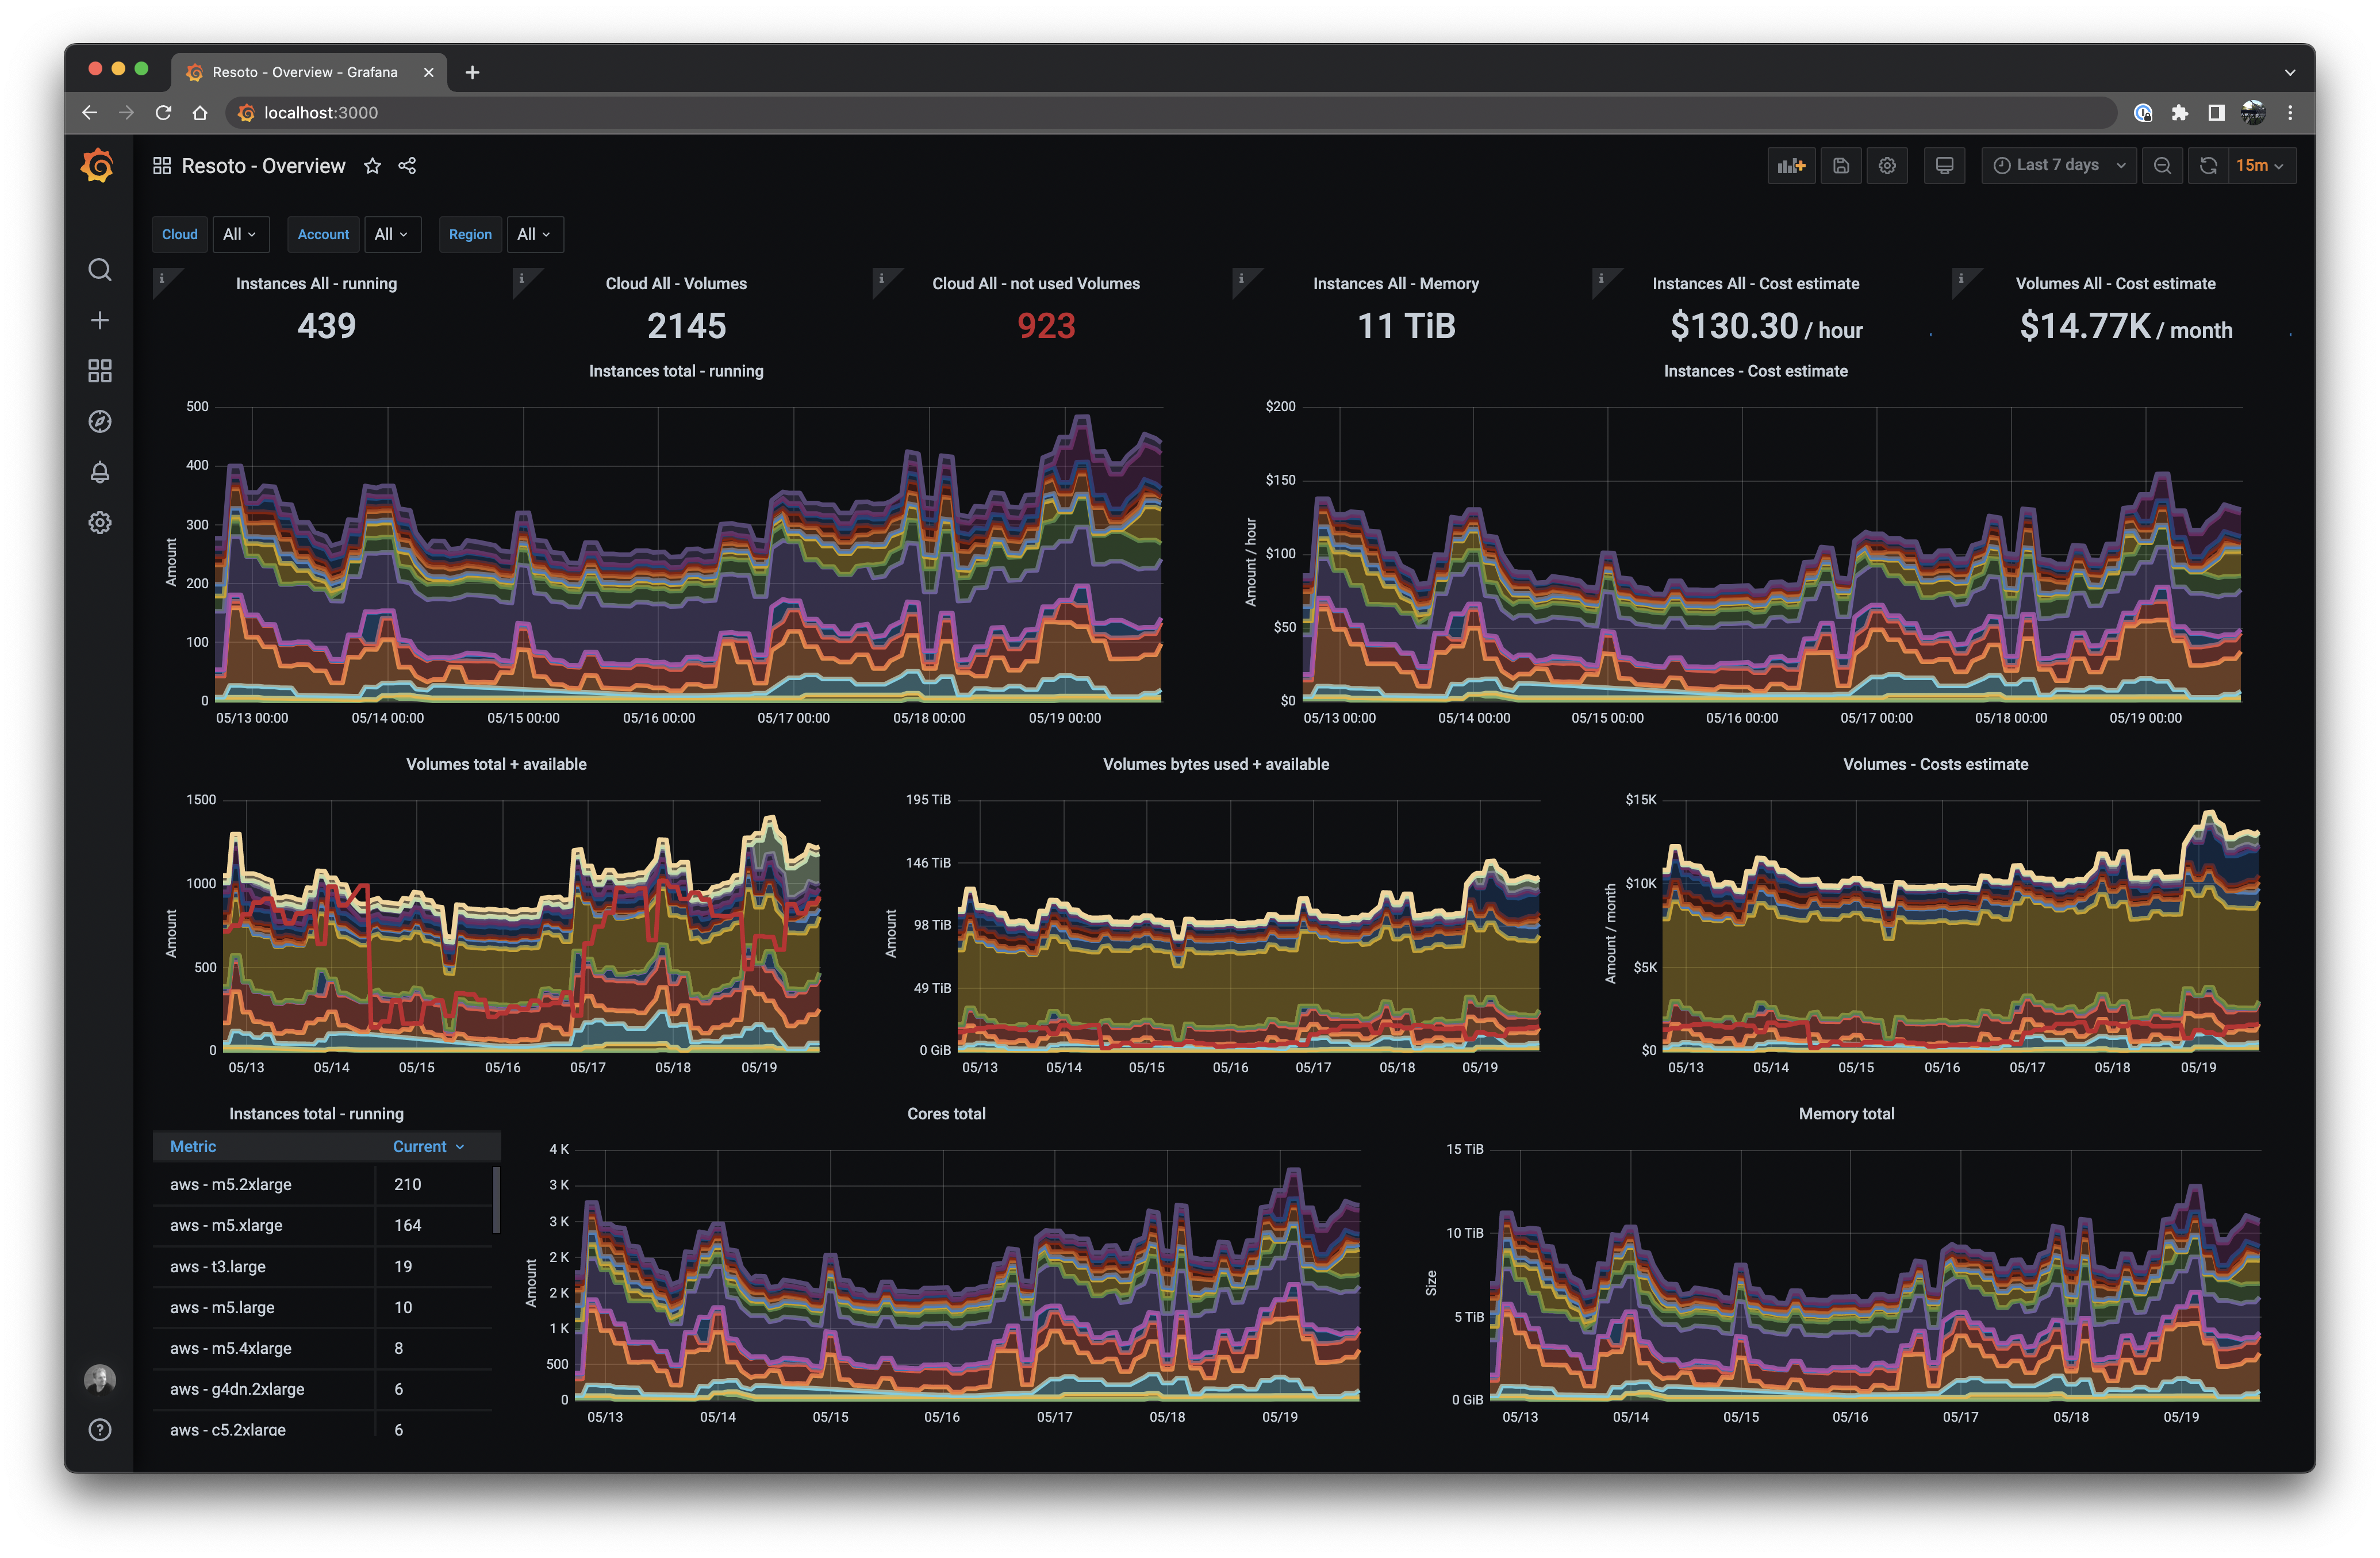
This is the actual production dashboard from a real Resoto user. 🥰
The dashboard shows the amount of compute and storage currently in use, as well as the associated cost. It also graphs volumes that are not in use and pending cleanup by Resoto. They also have dashboards for quota limits and network-related stats, which individual teams use to monitor their cloud usage by exposing custom tags as Prometheus labels and filtering by team or project.
This user even contributed their Grafana dashboard templates to our GitHub repository, so you don't have to create them yourself. But if you want to customize it, you now know how!
Install Resoto and build your own dashboard today! ✨
