Discover Kubernetes Resources

Kubernetes has dramatically improved the way we manage our workloads. It has become the de-facto standard for deploying and managing containerized applications, and is available in all major cloud providers.
A typical setup consists of distinct Kubernetes clusters for each application stage (e.g., dev, test, prod) or a cluster per tenant, and Kubernetes clusters shared between different users and teams often utilize namespaces and roles to control access. Deploying a single application to a Kubernetes cluster usually consists of tens to hundreds of resources (e.g., deployments, services, ConfigMaps, secrets, ingresses, etc.).
Even a relatively simple setup quickly becomes tedious to manage as the resource count grows. It is difficult for a human to keep track of resources, especially with user access limited to certain clusters in select namespaces.
Kubernetes Support in Resoto
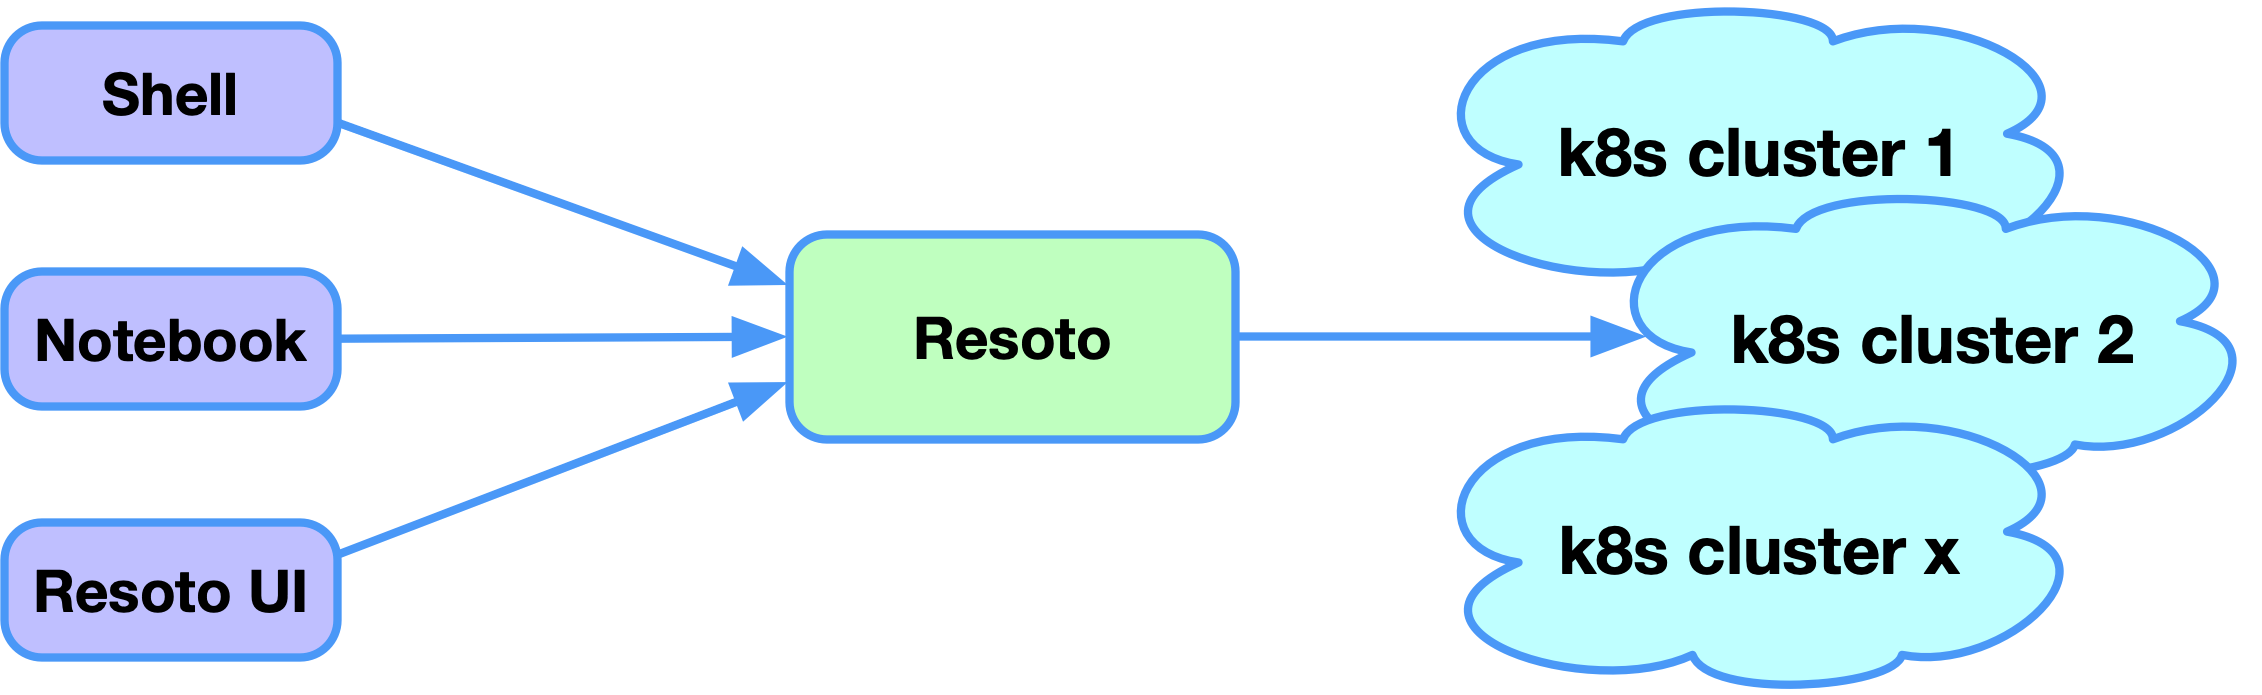
Kubernetes provides an API that returns information about a cluster's deployed resources. Resoto uses this API to build an index of resources in all of your Kubernetes clusters. Resoto continuously updates this index and the collected data is accessible via Resoto Shell, Resoto Notebook, or Resoto UI.
The examples presented in this blog post are available in the someengineering/resotonotebook GitHub repository.
Try them out on your own Kubernetes cluster after installing Resoto!
Full-Text Search
One of the simplest ways to find resources in your cluster is using Resoto's full-text search.
Resoto indexes the properties of all services in every namespace in each cluster. To perform a full-text search, simply provide your search term to the search command enclosed in double quotes:
> search "10.245.11.204"
kind=kubernetes_service, id=377f0, name=test-service, age=6d23h, cloud=k8s, account=dev, region=test
The searches for IPv4 address 10.245.11.204 returned a single resource of kind kubernetes_service. To see all properties of this service, pipe the result of the search to the dump command:
> search "10.245.11.204" | dump
reported:
id: 377f0c0b
tags:
kubernetes.digitalocean.com/load-balancer-id: bdf3a6cf-fa5a-4241-b344-91b93506ee02
name: test-service
ctime: '2022-08-22T09:06:04Z'
resource_version: '3024417'
namespace: test
service_status:
load_balancer:
ingress:
- ip: 164.90.240.138
service_spec:
allocate_load_balancer_node_ports: true
cluster_ip: 10.245.11.204
cluster_ips:
- 10.245.11.204
external_traffic_policy: Cluster
internal_traffic_policy: Cluster
ip_families:
- IPv4
ip_family_policy: SingleStack
ports:
- node_port: 30304
port: 80
protocol: TCP
target_port: '80'
type: LoadBalancer
kind: kubernetes_service
age: 6d23h
Filtering Resources
While Resoto's full-text search is a convenient way to find resources, you often want to specify additional criteria to filter the results. For example, we may want the results to only include resources of a specific kind or filter for nodes with specific attributes.
Since Resoto itself can be installed on a Kubernets cluster using the Helm chart, we can search for pods with names containing "resoto":
> search is(kubernetes_pod) and name=~resoto
kind=kubernetes_pod, id=7d2e76ef, name=resotocore-ndqfs, age=11d19h, cloud=k8s, account=dev, region=resoto
kind=kubernetes_pod, id=7c7c6cfa, name=resotometrics-8vbwp, age=11d19h, cloud=k8s, account=dev, region=resoto
kind=kubernetes_pod, id=6297b9e1, name=resotoworker-8rzjq, age=11d19h, cloud=k8s, account=dev, region=resoto
Finding the Services of a Pod
Kubernetes uses labels and selectors to define the relationship between a service and a pod. It is valid to expose the same pod via different services. To reveal which service exposes a pod, we need to understand the selector syntax and check all pods for matching labels. Thankfully, Resoto analyzes the relationships between resources, providing this information as edges between nodes and revealing a directed acyclic graph.
To understand the concept of a graph a bit better, let me show you two examples that we present in our Jupyter notebook via display_svg(rnb.graph(...)):
is(kubernetes_service) and name=test-service -[0:2]->

We are searching for a specific Kubernetes service with the name test-service and asking to traverse all outgoing dependencies from the service to a maximum depth of two. The result is a graph that shows the service and three pods behind this service, that all reference the same configmap.
is(kubernetes_service) and name=test-service <-[0:2]-

We can do the same query, but this time reverse the direction of the arrow, showing us all incoming dependencies up to two levels. This time we see all resources that have a dependency on this service.
Resoto understands the underlying provider of this Kubernetes cluster, in this case, DigitalOcean.
This service type is LoadBalancer, so a publicly available load balancer needs to be provided. A DigitalOcean load balancer is used here, backing the Kubernetes service. You can also see that the DigitalOcean load balancer is provided in the Frankfurt region in the default VPC.
All of this knowledge is gathered automatically by Resoto without any additional action.
With this knowledge at hand, it is easy to get the services that expose a specific pod: we filter for the pod in question, walk the dependencies inbound by one step and then filter the resulting list of incoming dependencies for services.

> is(kubernetes_pod) and name=~bbw7m <-- is(kubernetes_service)
kind=kubernetes_service, id=377f0c0b, name=test-service, age=7d, cloud=k8s, account=dev, region=test
We can list the pods that are exposed by a specific service the same way: we filter for the service, walk the graph one step outbound and filter the result list of resources to return only pods:

> search is(kubernetes_service) and name=~test --> is(kubernetes_pod)
kind=kubernetes_pod, id=7bb6478e, name=test-deployment-bbw7m, age=7d, cloud=k8s, account=dev, region=test
kind=kubernetes_pod, id=84ab880b, name=test-deployment-pmgmm, age=7d, cloud=k8s, account=dev, region=test
kind=kubernetes_pod, id=a3207ba4, name=test-deployment-vrngg, age=6d19h, cloud=k8s, account=dev, region=test
Getting the list of pods behind a service is also possible when we start from a specific pod. We need to combine two walks: find the pod and walk inbound to the service, then walk outbound from the service to all pods of this service. As you can see, traversals in the graph can be chained together. You can chain as many traversals as you want.

> search is(kubernetes_pod) and name=~bbw7m <-- is(kubernetes_service) --> is(kubernetes_pod)
kind=kubernetes_pod, id=7bb6478e, name=test-deployment-bbw7m, age=7d, cloud=k8s, account=dev, region=test
kind=kubernetes_pod, id=84ab880b, name=test-deployment-pmgmm, age=7d, cloud=k8s, account=dev, region=test
kind=kubernetes_pod, id=a3207ba4, name=test-deployment-vrngg, age=6d19h, cloud=k8s, account=dev, region=test
The result of this search is the same as the previous one since we were starting from the same pod.
Use the Force Graph, Luke!
Walking the relationships of a resource graph can reveal a lot of useful information.
For example, let's say we want to know the amount of memory and the number of CPU cores available on the node running a specific pod:
> search is(kubernetes_pod) and name~resotocore <-- is(instance) | list instance_memory, instance_cores
instance_memory=2, instance_cores=1
The above search reveals that the pod runs on a rather weak node with only 2 GB of memory and a single CPU core.
Next, consider a scenario where we may have secrets no longer read by any Kubernetes resource. It is best practice to remove unused secrets, to reduce the risk of unauthorized access to your resources. To accomplish this task, we will filter the search for nodes of a kind kubernetes_secret that do not have a relation:
> search is(kubernetes_secret) with(empty, <-- not is(kubernetes_namespace))
kind=kubernetes_secret, id=cb3fdf32, name=nginx-letsencrypt-test, age=5mo24d, cloud=k8s, account=dev, region=test
The with clause allows us to find resources with specific relationships to other resources. Here, we searched for secrets without incoming relationships to resources aside from the owning namespace.
Finally, we'll find all incoming and outgoing dependencies of pods with name containing "resoto." As seen earlier, there are three such pods in the cluster. We can find the transitive dependencies of these resources using the <-[0:]-> traversal, which follows both incoming (<--) and outgoing (-->) dependencies until it reaches either a leaf or the graph root:
> search is(kubernetes_pod) and name~resoto <-[0:]->

The red nodes in the lower right corner of the above graph represent the three pods, and the other nodes depict their transitive dependencies. We can intuit quite a bit of information from this graph:
- The three pods belong to three different deployments and replica sets.
- Resoto Core has an attached service.
- The three pods are running on two nodes.
- DigitalOcean droplets back the nodes from a DigitalOcean Kubernetes cluster with version 1.23.9.
- The Kubernetes cluster is running in Frankfurt on the default VPC.
Counting Resources
Resoto can count resources or properties with the count command.
The following counts the number of pods in all clusters:
> search is(kubernetes_pod) | count
total matched: 67
total unmatched: 0
namespace is a property of each pod, and we can also count the pods for each namespace:
> search is(kubernetes_pod) | count namespace
test: 3
resoto: 6
posthog: 16
kube-system: 42
total matched: 67
total unmatched: 0
The results reveal that there are four namespaces: test, resoto, posthog and kube-system. Most of the pods are running in the kube-system namespace.
Now, let's try to count the number of pods running on every node. Doing so is a bit more complicated since this information is not a property of the pod. However, we can get the node data by extracting the data from the graph. Resoto provides a special syntax to access the ancestors and descendants of a resource:
> search is(kubernetes_pod) | count /ancestors.kubernetes_node.reported.name
dev-7u121: 9
dev-7u129: 10
dev-7u12z: 11
analytics-7u14b: 12
analytics-7u14r: 12
analytics-7u14w: 13
The above search result shows that there are two clusters, each with three nodes. The result also includes the number of pods running on each of these nodes.
The same approach can be used for counting the number of pods in each deployment:
> search is(kubernetes_pod) | count /ancestors.kubernetes_deployment.reported.name
Aggregation
count is actually an aggregation. Aggregations apply functions like min, max, avg, and sum on the a resource's property values.
Here, we combine some of the above searches to count the number of pods in each node, in addition to getting the amount of memory and CPU cores available on each node:
> search is(kubernetes_pod) | aggregate /ancestors.instance.reported.name as node_name: sum(1) as pod_count, min(/ancestors.instance.reported.instance_memory) as memory, min(/ancestors.instnace.reported.instance_cores) as cores
The following table shows the results of the aggregation:
node_name | pod_count | memory | cores |
|---|---|---|---|
analytics-7u14w | 13 | 8 | 2 |
analytics-7u14r | 12 | 8 | 2 |
analytics-7u14b | 12 | 8 | 2 |
dev-7u12z | 11 | 2 | 1 |
dev-7u129 | 10 | 2 | 1 |
dev-7u121 | 9 | 2 | 1 |
While aggregation can be helpful for adhoc queries, we can also turn this data into a time series and watch the values over time. See Actionable Cloud Infrastructure Metrics for more details.
Heatmaps
Jupyter Notebook, a web-based interactive Python shell, makes it easy to visualize data. One option available out-of-the-box is heatmaps. Imagine that you have many clusters and want to see where compute instances are running. Heatmaps provide a clear visuzalization of this data:
import plotly.express as px
data = rnb.search("is(instance)")
px.density_heatmap(data, x="account_id", y="instance_cores")
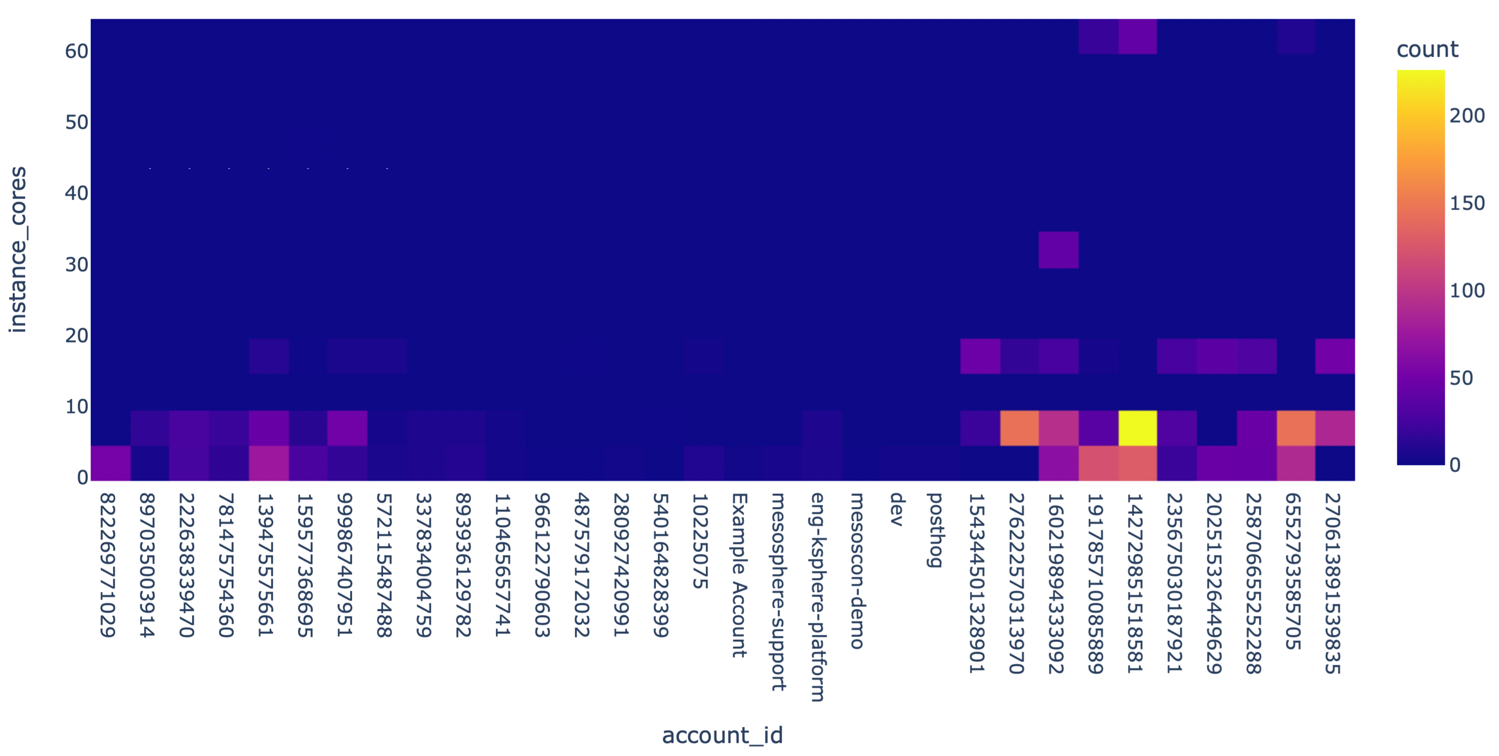
The heatmap shows accounts on the x-axis (each Kubernetes cluster is represented as an account) and the number of cores on the y-axis. Each square in the grid is color-coded to reflect the node count. It is clear at first glance that the cluster with ID 142729851518581 uses the most compute instances.
Alerting
It is easy to integrate Resoto with other systems and services for custom alerting. Resoto ships with a discord custom command to send notifications to a Discord channel. It is also possible to configure alerts to be sent to other services, such as Prometheus Alertmanager.
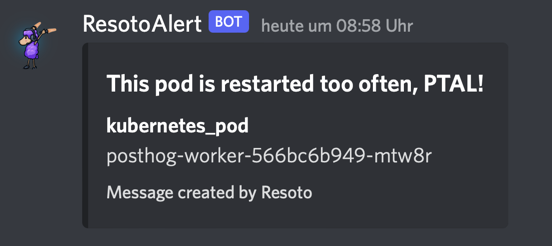
One scenario where it is desirable to send alert notifications is when a pod is restarting too often.
To configure alerts for this scenario, we first need to define a search query to find such pods:
> search is(kubernetes_pod) and pod_status.container_statuses[*].restart_count>42
kind=kubernetes_pod, id=3f16abea, name=posthog-worker-mtw8r, restart_count=[1], age=14d2h, cloud=k8s, account=posthog, region=posthog
A pod can have several containers, and restart_count is property of each container status. Since we do not care which container is restarting too often, we use the wildcard * to match all container statuses. The above search found a single pod that meets this criteria.
Now that we've defined the search criteria, all we need to do is pipe the results to the discord custom command with the desired message title:
> search is(kubernetes_pod) and pod_status.container_statuses[*].restart_count>42 | discord title="This pod is restarted too often, PTAL!"
1 requests with status 204 sent.
However, the above command only executes a single time. We would like for Resoto to constantly monitor for pods that are restarting too often and send a notification whenever such pods are found. To do so, we can create a job using the job command:
> jobs add --id pod_restarted_too_often --wait-for-event post_collect 'search is(kubernetes_pod) and pod_status.container_statuses[*].restart_count>0 | discord title="This pod is restarted too often, PTAL!"'
Job pod_restarted_too_often added.
We registered this job with the post_collect event, so it will be executed automatically whenever new data has been collected.
Kubernetes… and More!
Resoto is not only able to collect resource metadata from Kubernetes, but also other cloud providers as well.
Resoto is open source and free to use, and currently supports AWS, Google Cloud, and DigitalOcean.
Install Resoto today!
