Dashboards
Overview
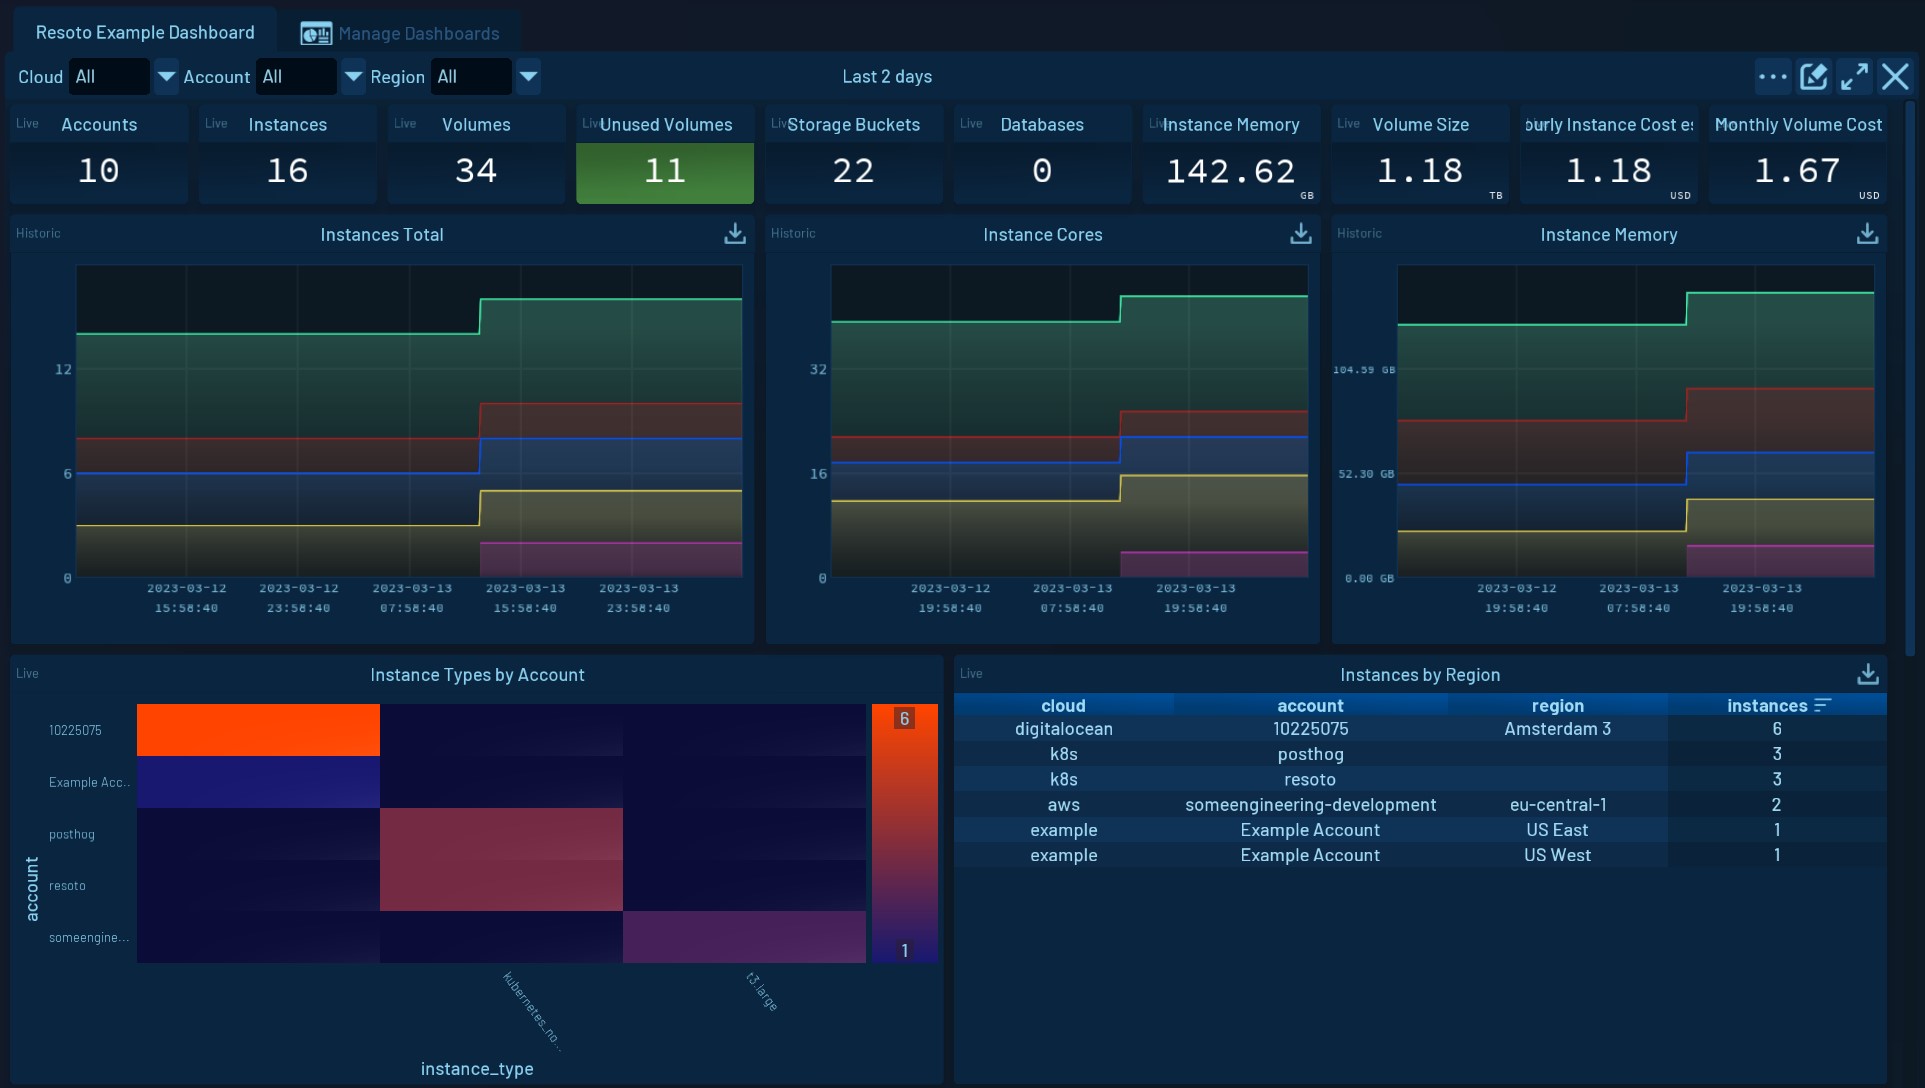
The Dashboards feature provides you with rich insights about your infrastructure that is being scraped by Resoto.
You can build dashboards or use pre-built dashboards that come out of the box.
Dashboards are made up of different widgets that display data in different visual ways, such as tables, charts, and maps. Widgets can use different data sources, including historic data from a time series database like Prometheus, or live data directly from Resoto Core.
Dashboards are saved in Resoto Core in JSON format and can be managed using the Configuration Editor.
Interface
Dashboards can be accessed through a tab selection at the top of the screen.
Manage Dashboards
The last tab is the Manage Dashboards tab, where you can add, delete, duplicate, and open dashboards.
In this interface you can also drop a dashboard's exported json file to import the dashboard into your Resoto UI.
Closing a dashboard using the ✖ button will only close it, not delete it. You can re-open your dashboard again in the Manage Dashboards tab.
Top
The main toolbar is located at the top of the view. Here you can filter the dashboard data by Cloud, Account, or Region. You can also change the time range that is displayed on the dashboard in the center of the toolbar.
Widgets using data sources that display Live Data are ignoring the time range settings.
On the right side of this toolbar, you will find four more buttons: more, edit mode, maximize the view and close dashboard. Clicking more will open up a popup where you can change the automatic refresh rate of the dashboard, export the dashboard to JSON (which can also be imported again), renaming or delete the dashboard.
Clicking the edit mode button will change the current dashboard's state between view mode and edit mode. While a dashboard is in edit mode, you can add, modify, or delete widgets.
Bottom
When a dashboard is opened, the bottom part of the screen will display the dashboard with its widgets. While the dashboard is in edit mode, you can modify the widgets in this part of the view.
Widgets
The following widgets can be used to build Resoto Dashboards
Data Sources
- Search (Live Data)
- Aggregate Search (Live Data)
- Time Series (Historic Data)
- Two Entries Aggregate (Live Data)
- Fixed Aggregate (Live Data)
Next Steps
Now that you know about the Dashboards feature, you can start exploring it on your own! Check out the pre-built dashboard (Resoto Example Dashboard), or create your own to get insights into the infrastructure you're monitoring.
