Widgets
Overview
A Dashboard Widget can be imagined best as a small application to display Resoto data in a visual representation. A Widget is placed inside a Dashboard and gets its content from a Data Source that is attached to the Widget.
Every Widget can only display certain types of data and use only certain types of Data Sources.
Adding Widgets to a Dashboard
When the Dashboard is in Edit Mode, you can add a new Widget by clicking the + Add Widget button at the top right.
![Resoto UI Add Widget Popup]In this view, you can configure the new widget. On the left half of the windows, you find all the settings to set which data the Widget will use. You can add one or more Data Sources and select their types on the top part, after clicking the + button, you need to set up the Data Source below.
On the right side, you get a preview of the widget and find all the visual settings.
Widget Types
Indicator
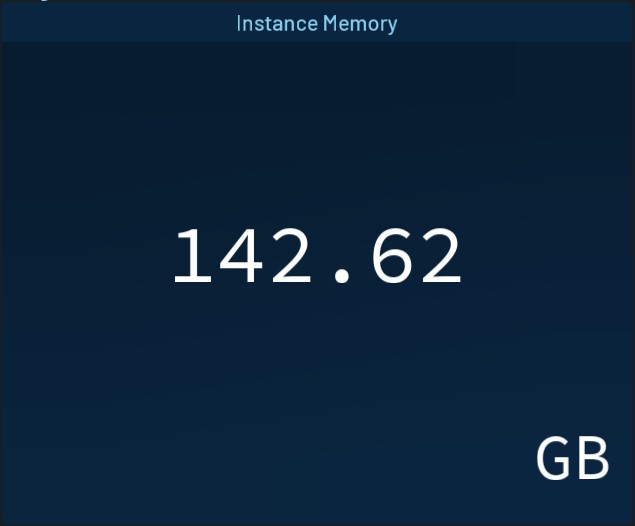
The Indicator Widget displays data as a Number. In the Widgets Options, you can change the background color to change according to the current value.
Data Sources
Indicator Aggregate Data Source examples
- Monthly Volume Cost estimation
aggregate(sum(/ancestors.volume_type.reported.ondemand_cost) as volumes_monthly_cost_estimate): is(volume) - Total Instance memory across all clouds
aggregate(sum(instance_memory * 1024 * 1024 * 1024) as instances_memory): is(instance) - Total Instances across all clouds
aggregate(sum(1) as instances_total): is(instance) - The Number of volumes that are available and have are older than 2 hours.
aggregate(sum(1) as volumes_total): is(volume) and volume_status = available and age > 2h
Chart
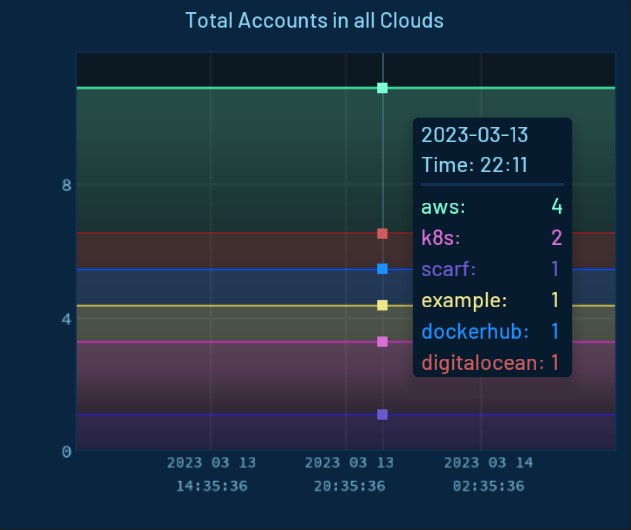
The Chart Widget displays time series data as a line chart. You can change settings to display the values of each Data Source stacked or unstacked.
Data Sources
Chart Time Series Data Source examples
- Total Accounts across all clouds
sum(resoto_accounts_total{$dashboard_filters}) - Accounts per cloud
resoto_accounts_total{$dashboard_filters}
Table
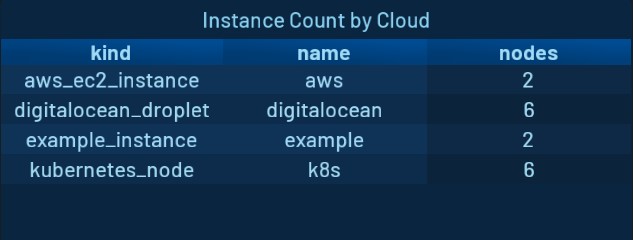
The Table Widget is a very flexible way to display search or aggregation results. When using a Search Data Source, a click on a row takes you to Explore view to display the clicked resource.
Data Sources
You can export the displayed data directly from the widget by clicking the export button on the top right.
Table Aggregate Search Data Source examples
- Instances per kind and cloud
aggregate(kind, /ancestors.cloud.reported.name: sum(1) as nodes): is(instance) - Instances per type and account
aggregate(instance_type, /ancestors.account.reported.name: sum(1) as instances): is(instance)
Heatmap
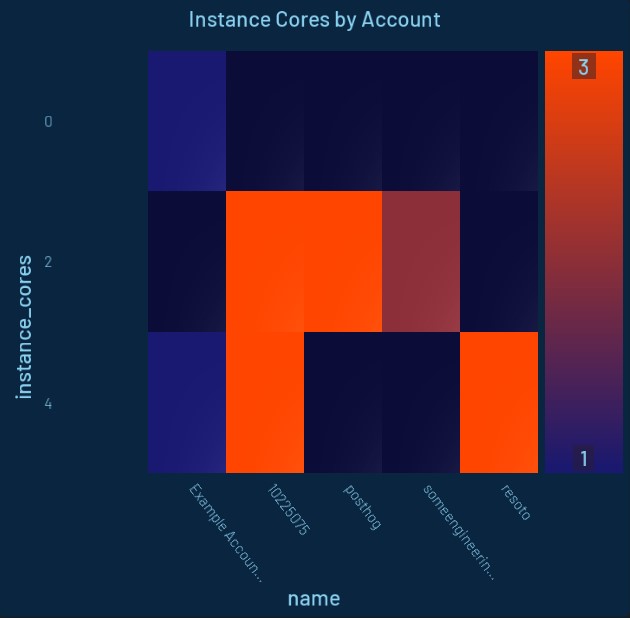
The Heatmap Widget provides a visual tool to quickly find hotspots of certain metrics in the infrastructure. A good example would be to display the core count or memory of compute instances.
Data Sources
Heatmap Aggregate Data Source examples
- Instances per type and account
aggregate(instance_type, /ancestors.account.reported.name: sum(1) as instances): is(instance) - Instance number per account and instance type
aggregate(/ancestors.account.reported.name as account_name, instance_type as type: sum(1) as instances) : is(instance)
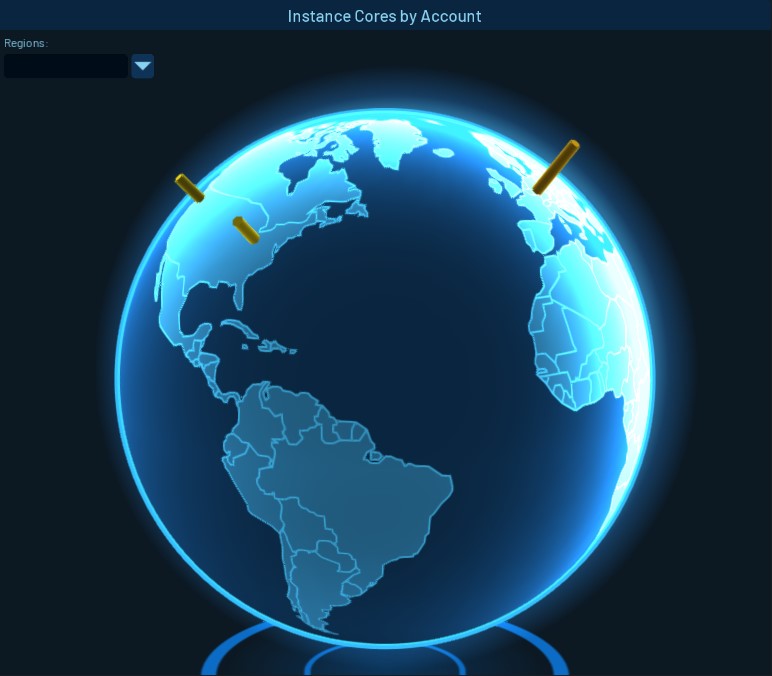
World Map
The World Map Widget is a way of displaying elements grouped by the geolocation of their regions on a world map.
Data Sources
World Map Fixed Aggregate Data Source examples
- Instances number per region and cloud
aggregate(/ancestors.cloud.reported.name as cloud, /ancestors.region.reported.name as region: sum(1) as instances) : is(instance)
